
|
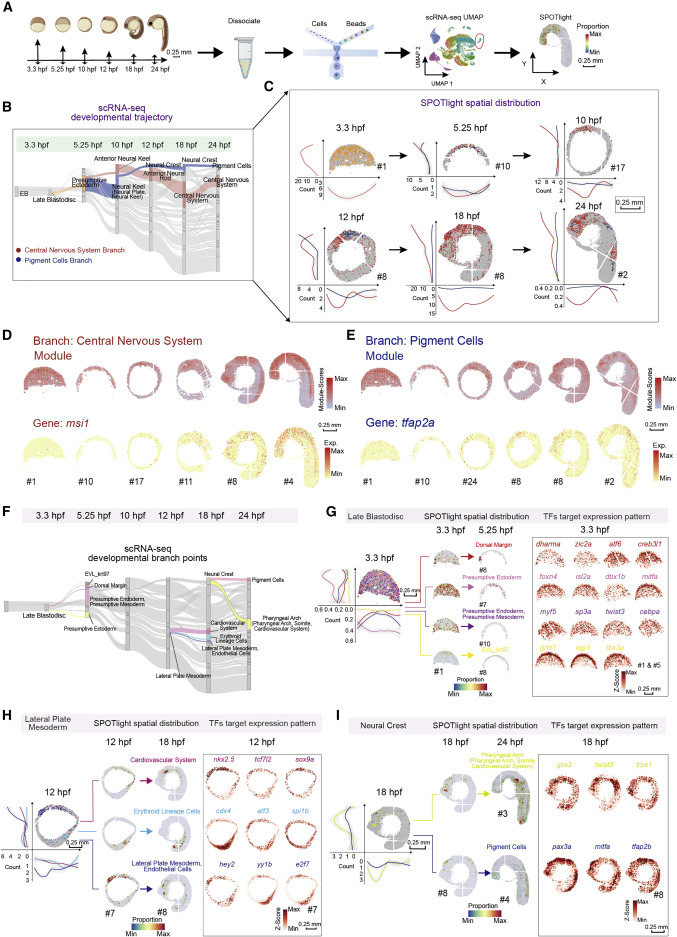
Fig. 4 Figure 4. Construction of the spatially resolved developmental trajectories by integrated analysis of the scRNA-seq and Stereo-seq data (A) Schematic representation of the workflow for scRNA-seq of zebrafish embryos at different developmental stages using the C4 system and integrated analysis with a combination of the scRNA-seq and Stereo-seq data by applying SPOTlight. Scale bars, 0.25 mm. (B) Application of a Sankey diagram to visualize zebrafish embryo developing trajectory with scRNA-seq data. Two developmental branches which are developed from the presumptive ectoderm, namely, pigment cells, and central nervous system are simultaneously displayed on the Sankey diagram. (C) Application of SPOTlight to integrate Stereo-seq with scRNA-seq data to infer the spatially resolved developmental trajectories. Two developmental branches shown in (B) are simultaneously displayed on six sequential spatial sections to show the different spatial developmental trajectories. The graphs next to each section show bin counts distributions of corresponding cell types at two dimensions. The color legend is the same as that in Figure 4B. Scale bars, 0.25 mm. (D and E) Distribution of branch-specific gene module (top) and individual representative DEGs (bottom) of the central nervous system branch (D) and the pigment cells branch (E) on six sequential spatial sections. Scale bars, 0.25 mm. (F) Three selected developmental branch points at 3.3-, 12-, and 18-hpf. The late blastodisc (left), the lateral plate mesoderm (middle) and the neural crest (right), are shown in the Sankey diagram. (G–I) Cell-fate regulatory maps of different developmental destinations at 3.3-, 12-, and 18-hpf are related to Figure 4F. SPOTlight was applied to visualize the spatial distribution of cell subgroups with different differentiation together on one section (left) and separately on each section (middle); the graphs next to each section show bin counts distributions of corresponding cell types at both x and y axes (left). The spatial expression distributions of selected representative crucial TFs target genes are visualized on embryonic sections (right). Scale bars, 0.25 mm.
Reprinted from Developmental Cell, 57(10), Liu, C., Li, R., Li, Y., Lin, X., Zhao, K., Liu, Q., Wang, S., Yang, X., Shi, X., Ma, Y., Pei, C., Wang, H., Bao, W., Hui, J., Yang, T., Xu, Z., Lai, T., Berberoglu, M.A., Sahu, S.K., Esteban, M.A., Ma, K., Fan, G., Li, Y., Liu, S., Chen, A., Xu, X., Dong, Z., Liu, L., Spatiotemporal mapping of gene expression landscapes and developmental trajectories during zebrafish embryogenesis, 1284-1298.e5, Copyright (2022) with permission from Elsevier. Full text @ Dev. Cell