
|
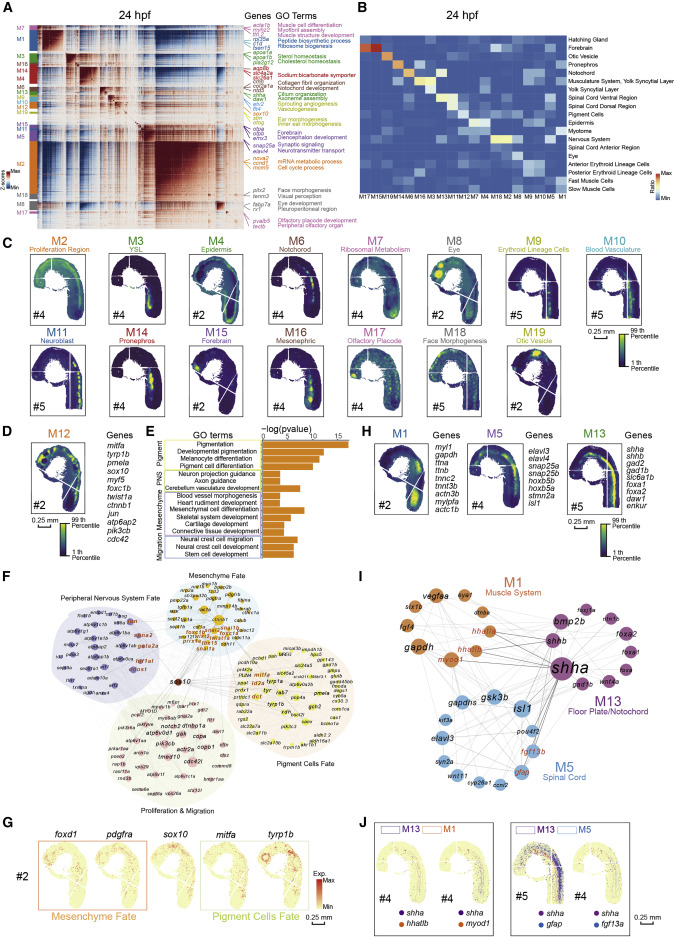
Fig. 3 Figure 3. Spatial modules identified by hotspot uncover the interaction among spatial regions in 24-hpf zebrafish embryo (A) Heatmap shows the genes with significant spatial autocorrelation (12,675 genes, false discovery rate [FDR] < 0.05) grouped into 19 gene modules based on pairwise spatial correlations of gene expression in multiple sections of the 24-hpf zebrafish embryo. Selected genes and GO terms related to representative modules are highlighted on the right side. (B) Heatmap shows the ratio of the bins with high module scores (>3) in each module distributed in different spatial clusters, and the spatial clusters of the 24-hpf embryo are from Stereo-seq dataset in Figure 2D. (C) Spatial visualization of module scores for modules on 24-hpf embryo sections. Scale bars, 0.25 mm. (D) Spatial visualization of module 12 (M12). Scale bars, 0.25 mm. (E) Bar graph shows significantly enriched selected gene ontology terms in M12. (F) Protein-protein interaction (PPI) network of genes in M12. The network is visualized by Cytoscape. Node size represents the relative connectivity, and the TFs that interacted with sox10 are highlighted by red color. (G) Spatial expression pattern of genes in M12. These genes are related to the development of pigment cells fate (green), mesenchyme fate (orange), and sox10. Scale bars, 0.25 mm. (H) Spatial visualization of modules related to notochord/floor plate and neighboring tissues on 24-hpf embryo sections including M1, M5, and M13. Scale bars, 0.25 mm. (I) PPI network of interactive genes with shha/b in the three modules in Figure 3H. Representative genes are highlighted by red color. (J) Spatial expression patterns of shha and the interactive genes. Scale bars, 0.25 mm.
Reprinted from Developmental Cell, 57(10), Liu, C., Li, R., Li, Y., Lin, X., Zhao, K., Liu, Q., Wang, S., Yang, X., Shi, X., Ma, Y., Pei, C., Wang, H., Bao, W., Hui, J., Yang, T., Xu, Z., Lai, T., Berberoglu, M.A., Sahu, S.K., Esteban, M.A., Ma, K., Fan, G., Li, Y., Liu, S., Chen, A., Xu, X., Dong, Z., Liu, L., Spatiotemporal mapping of gene expression landscapes and developmental trajectories during zebrafish embryogenesis, 1284-1298.e5, Copyright (2022) with permission from Elsevier. Full text @ Dev. Cell