
|
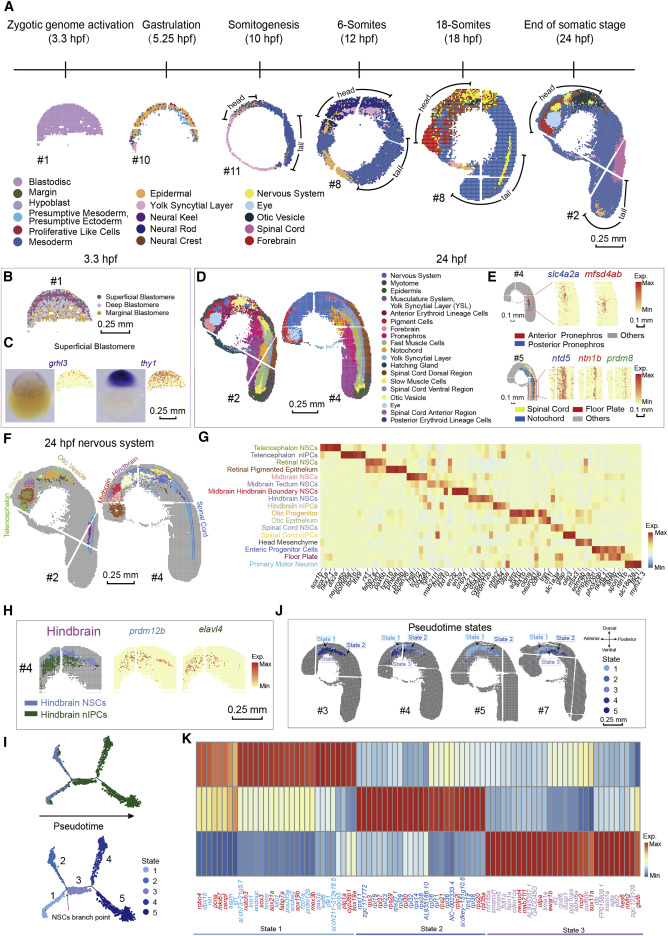
Fig. 2 Figure 2. A spatial transcriptomic atlas of the developing zebrafish embryo (A) Unsupervised clustering of the zebrafish embryo section across sequential developmental stages analyzed by Stereo-seq at bin-15. Bins are colored by different regions. Scale bars, 0.25 mm. In this study, all sections from 10- to 24-hpf are displayed with head on the upper left and tail on the bottom right. The “#number” next to the sections represents the number given to each section, and all the sections in the following figures are marked with the “#number.” (B) Unsupervised clustering of the 3.3-hpf zebrafish embryo sections at bin-15. Bins are colored by spatial identities inferred from expressed marker genes. Scale bars, 0.25 mm. (C) The in situ hybridization images and the expression patterns of marker genes grhl3 and thy1 for superficial blastomere at 3.3-hpf. Scale bars, 0.25 mm. (D) Unsupervised clustering of the 24-hpf zebrafish embryo sections at bin-15. Bins are colored by spatial identities inferred from expressed marker genes. Scale bars, 0.25 mm. (E) Spatial visualization of indicated areas of the 24-hpf embryo on the left: detailed anatomical structures identified in the pronephros, and a combined structure including the spinal cord, the floor plate, and the notochord. The expression patterns of marker genes for each anatomical structure are shown on the right. Scale bars, 0.1 mm. (F) Unsupervised subclustering of the 24-hpf zebrafish nervous system. Bins are colored by spatial identities and cell types inferred from expressed marker genes. The subcluster colors are the same as the font colors of cluster names in (G). Scale bars, 0.25 mm. (G) Heatmap shows the mean expression level of marker genes between the indicated clusters of the zebrafish nervous system. (H) Spatial visualization of the hindbrain at 24-hpf, from left to right including indicated cell types and the expression of marker genes of different cell types. Scale bars, 0.25 mm. (I) Pseudotime analysis of hindbrain-related clusters as performed by Monocle 2. Bins are colored by cell types on the top (color legends of cell types are the same as those in Figure 2H) and colored by pseudotime stages on the bottom. (J) Spatial visualization of detailed structures of pseudotime states identified by Monocle 2 in the hindbrain on different sections at 24-hpf. Scale bars, 0.25 mm. (K) Heatmap shows the mean expression level of the top 30 DEGs different pseudotime states 1, 2, and 3. Representative genes related to each state are highlighted by red color.
Reprinted from Developmental Cell, 57(10), Liu, C., Li, R., Li, Y., Lin, X., Zhao, K., Liu, Q., Wang, S., Yang, X., Shi, X., Ma, Y., Pei, C., Wang, H., Bao, W., Hui, J., Yang, T., Xu, Z., Lai, T., Berberoglu, M.A., Sahu, S.K., Esteban, M.A., Ma, K., Fan, G., Li, Y., Liu, S., Chen, A., Xu, X., Dong, Z., Liu, L., Spatiotemporal mapping of gene expression landscapes and developmental trajectories during zebrafish embryogenesis, 1284-1298.e5, Copyright (2022) with permission from Elsevier. Full text @ Dev. Cell