
Fig. 7
- ID
- ZDB-IMAGE-220526-19
- Publication
- Alhashem et al., 2022 - Notch controls the cell cycle to define leader versus follower identities during collective cell migration
- All Figures
- Figures for Alhashem et al., 2022
|
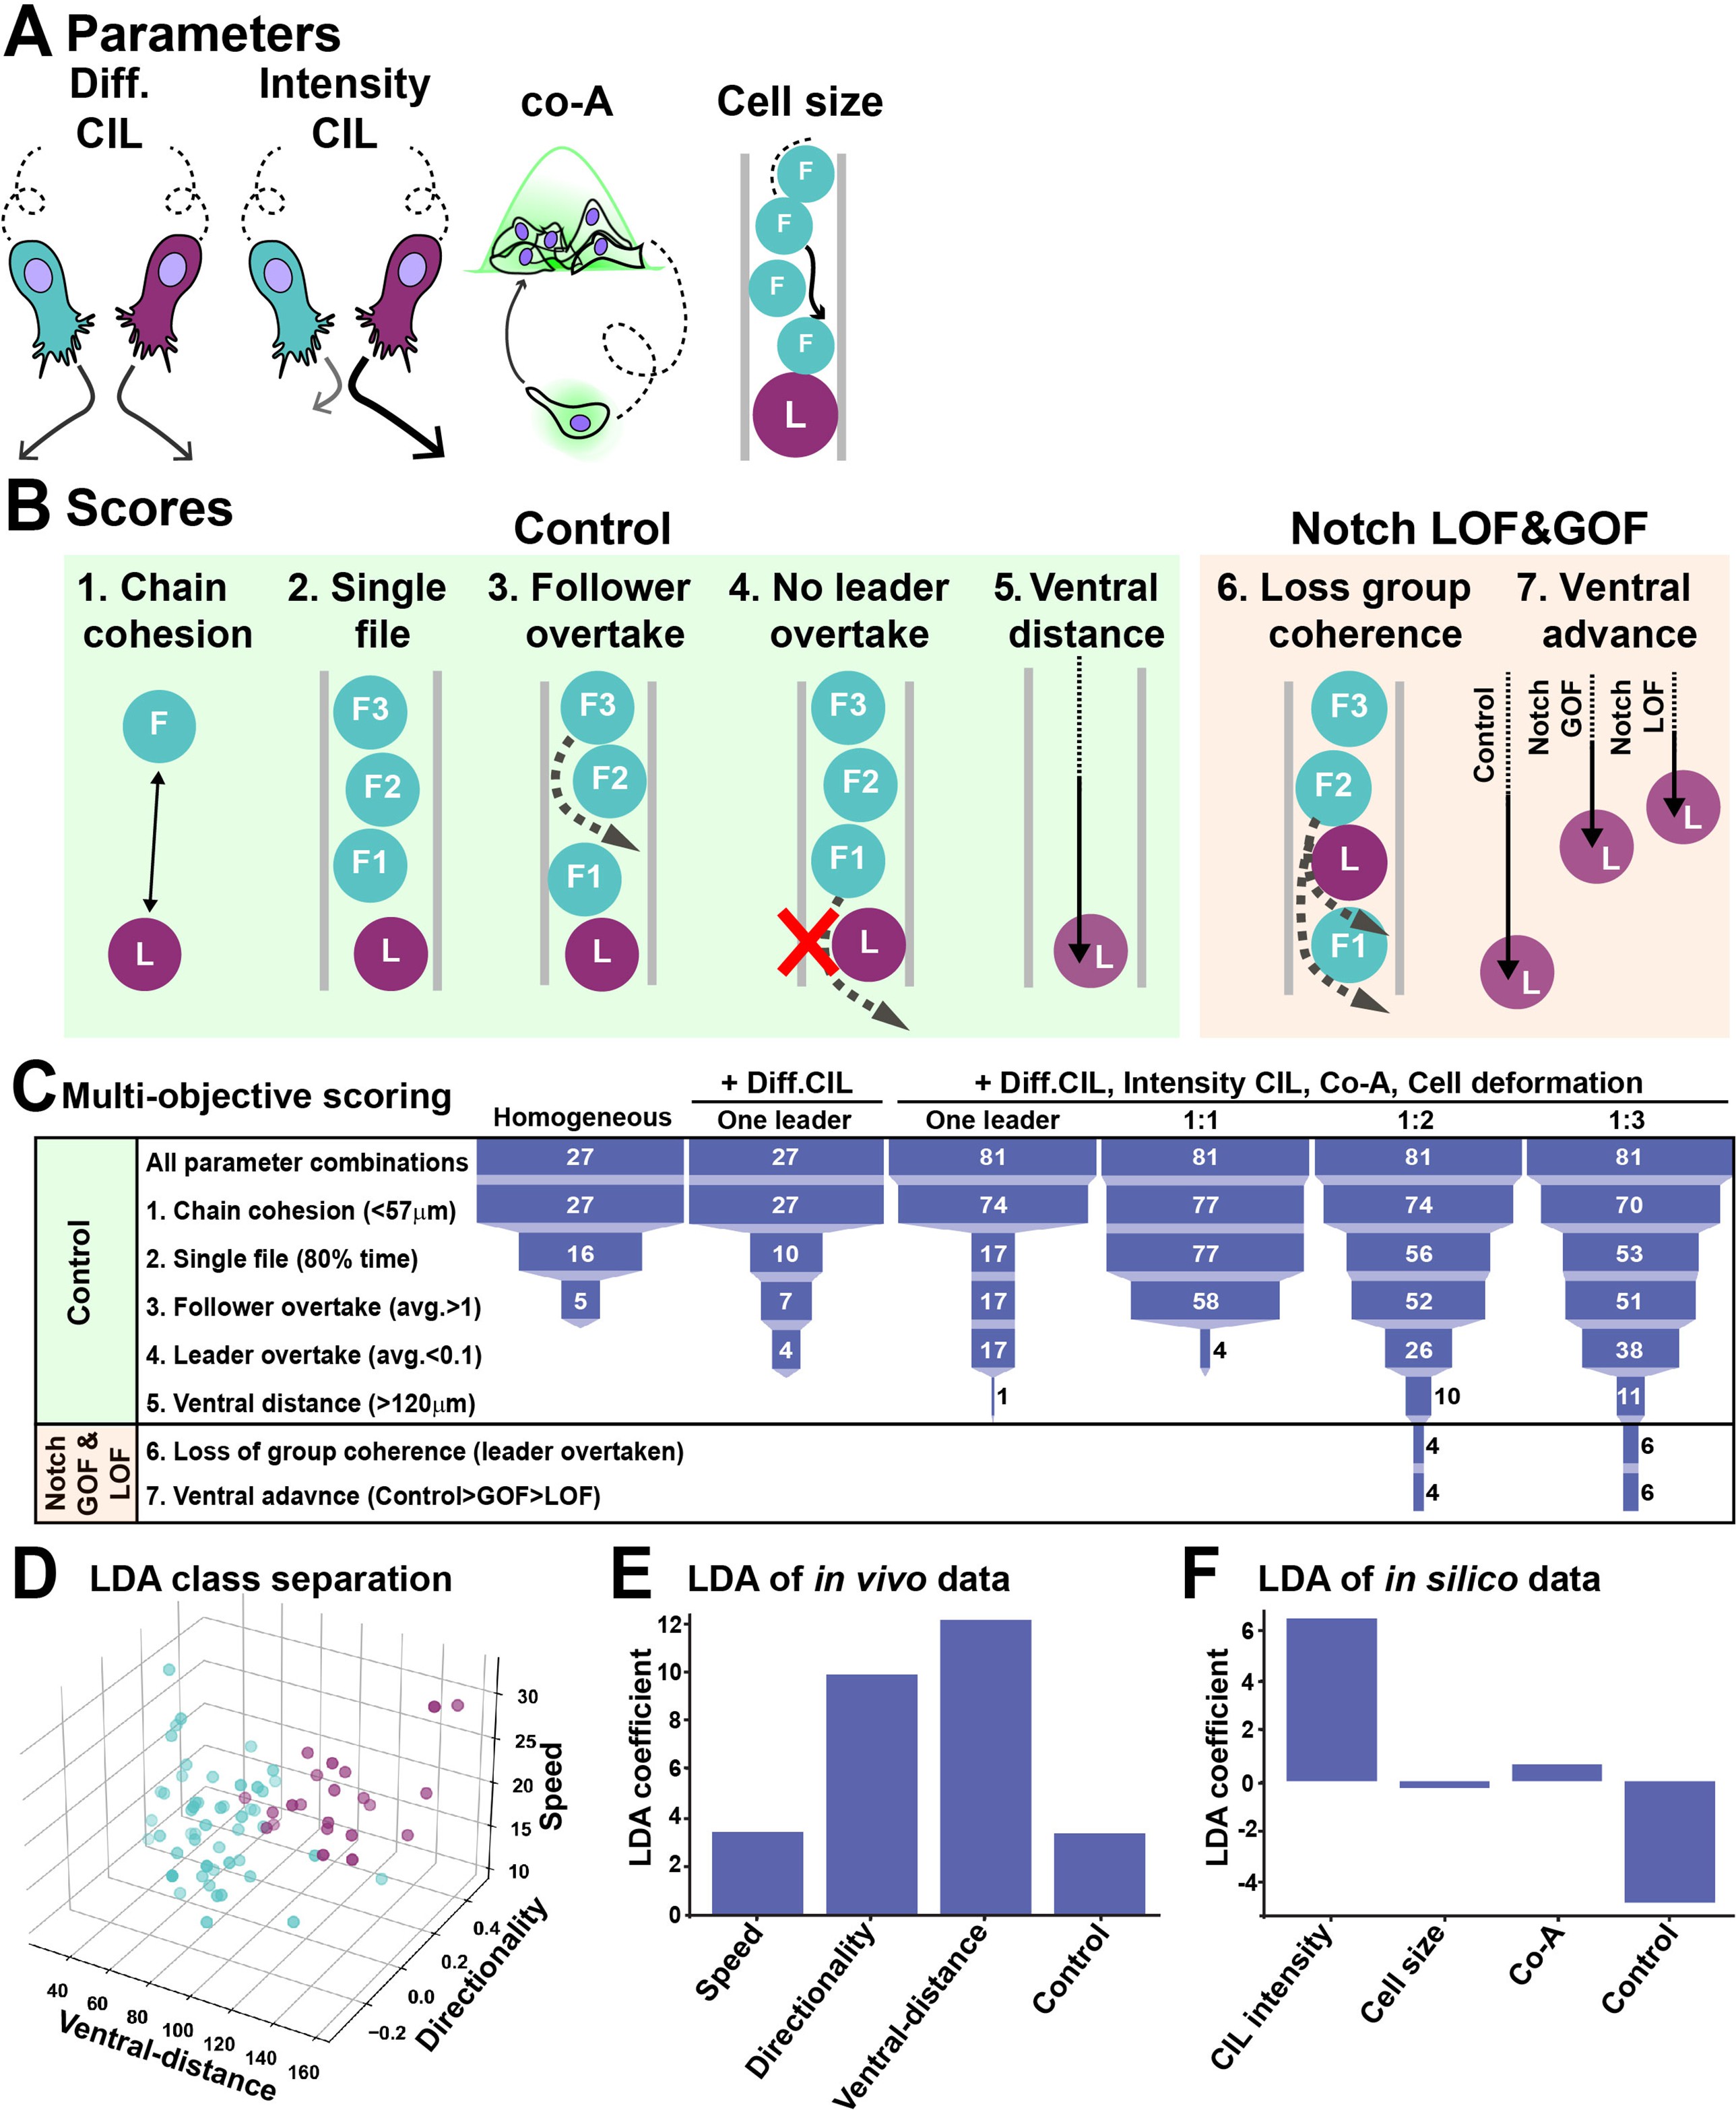
Fig. 7
(A) Schematics of model parameters. Diff CIL: only leader/follower collisions induce repulsion and change of directionality. Intensity CIL: the leader’s response upon collision is stronger than the follower’s response. Co-A: co-attraction pulls together cells at a distance. Cell size: volume exclusion. (B) Schematics of simulations multi-objective scores. (C) Depiction of parameter space analysis showing the number of parameters sets that fulfilled each score when different variables were tested. One leader refers to chains with a single leader cell. 1:1, 1:2, and 1:3 refer to leader/follower ratios. (D) 3D plot of linear discriminant analysis (LDA). (E) LDA coefficients of in vivo data. A random dataset was used as control. (F) LDA coefficients of in silico data. A random dataset was used as control.
In silico modelling of trunk neural crest (TNC) migration.