
Fig. 4
- ID
- ZDB-IMAGE-220526-14
- Publication
- Alhashem et al., 2022 - Notch controls the cell cycle to define leader versus follower identities during collective cell migration
- All Figures
- Figures for Alhashem et al., 2022
|
Fig. 4
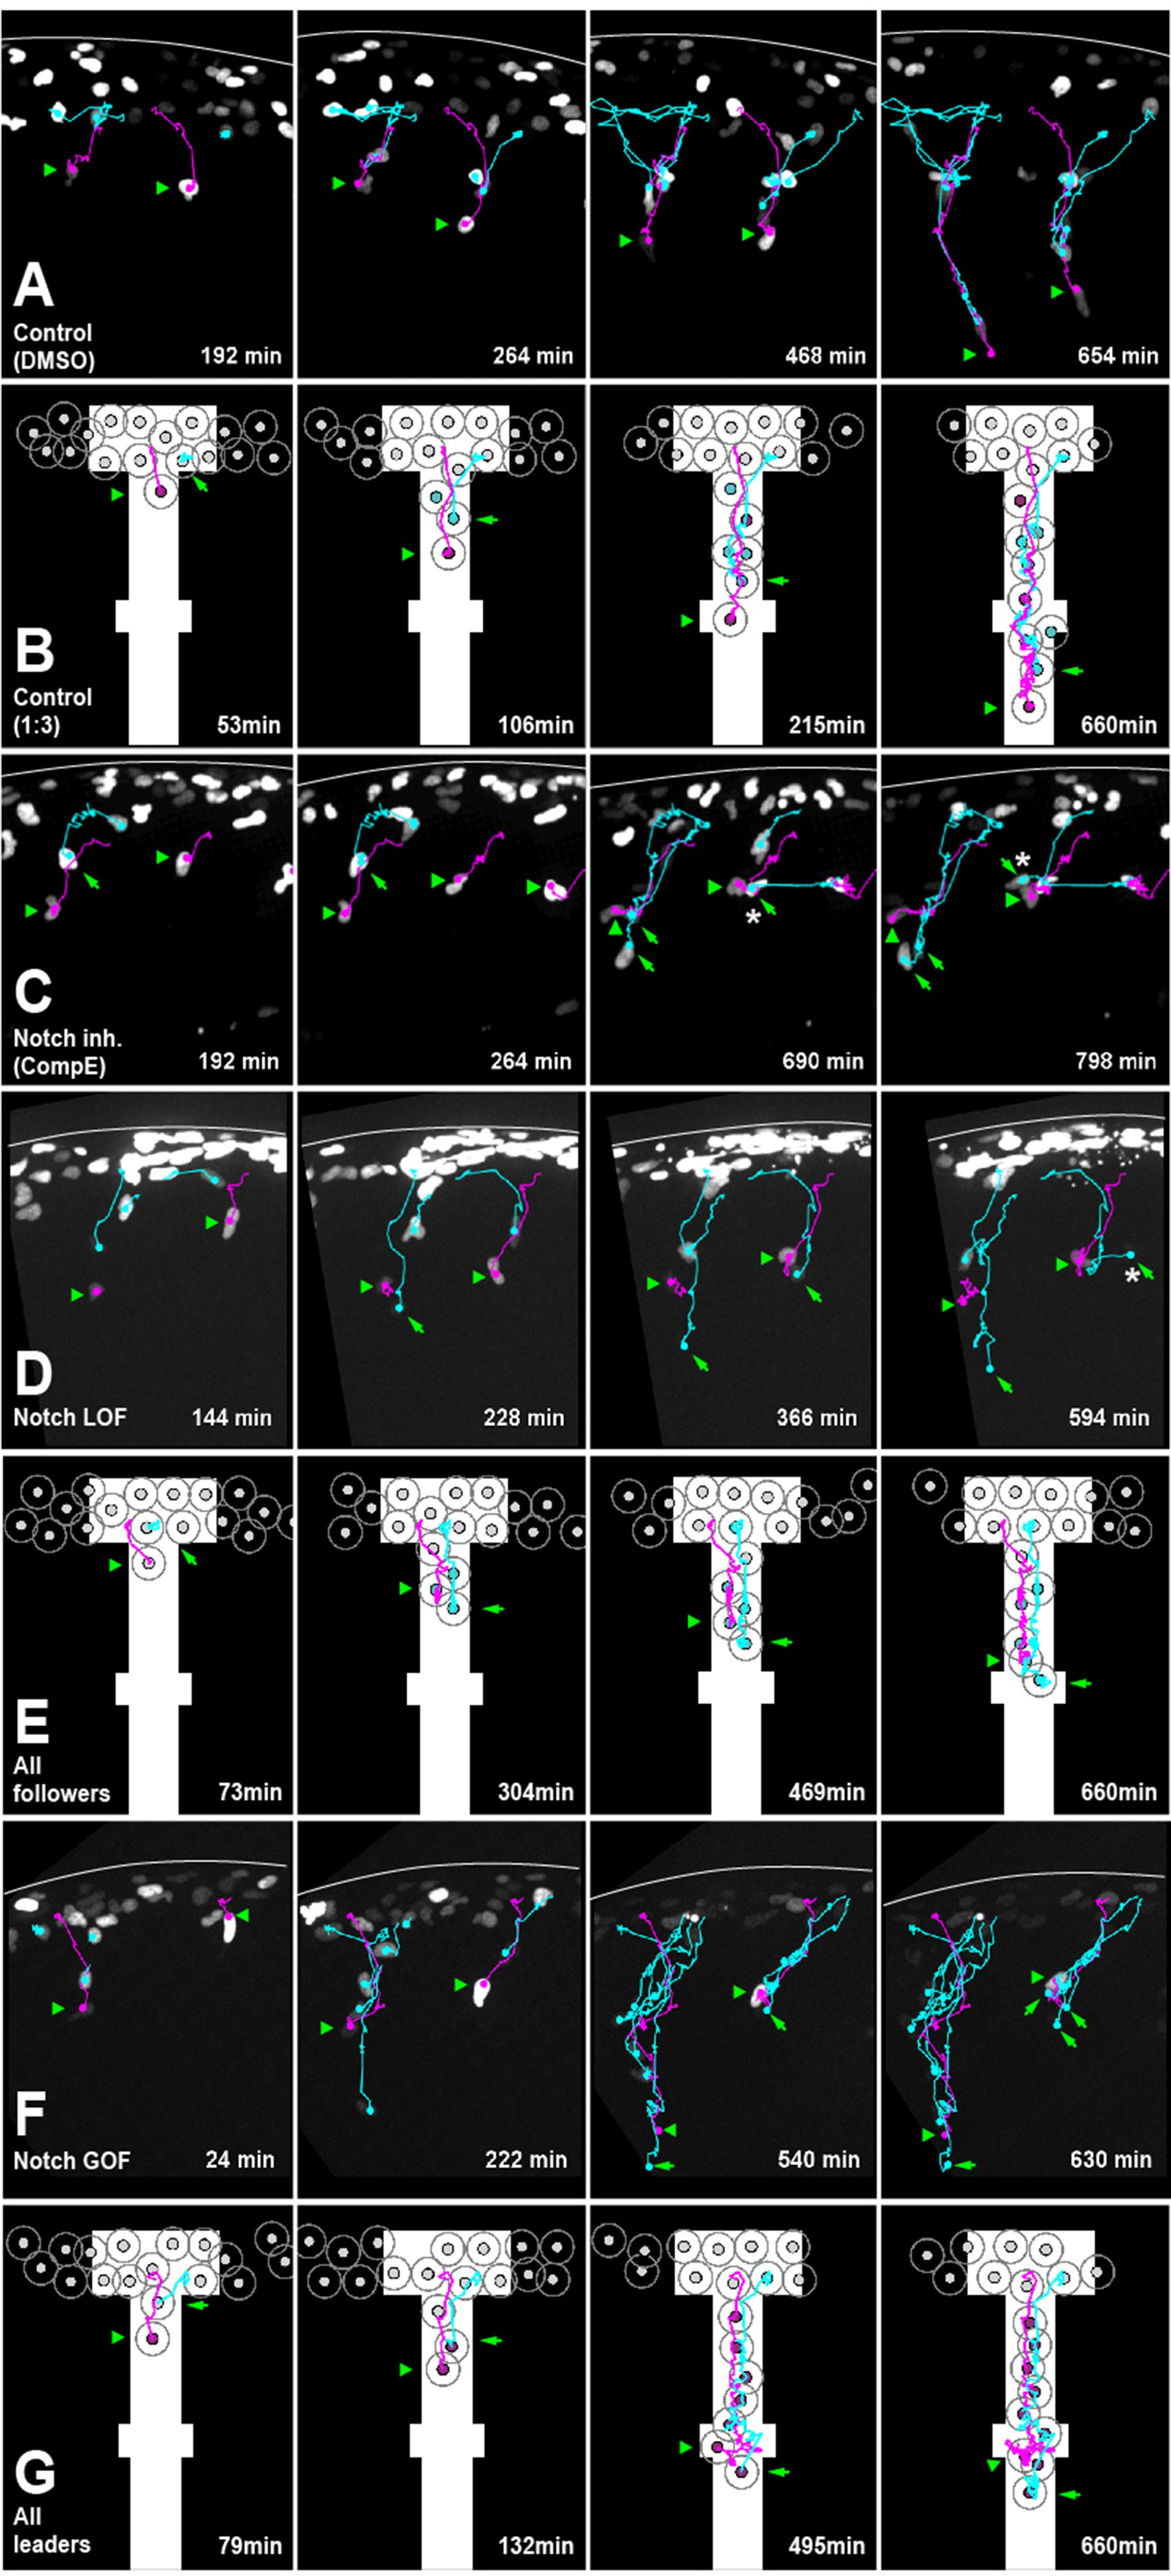
(A) Selected frames from in vivo imaging of Sox10:Kalt4 control (DMSO treated) embryos. (B) Selected frames from control simulation with 1:3 leader/follower ratio. (C) Selected frames from in vivo imaging under Notch-inhibited condition, Sox10:Kalt4 embryos treated with CompE. (D) Selected frames from in vivo imaging of Notch loss of function (LOF) condition, Sox10:Kalt4; UAS:dnSu(H) embryos. (E) Selected frames from all followers simulation. (F) Selected frames from in vivo imaging of Notch gain of function (GOF) condition Sox10:Kalt4; UAS:NICD embryos. (G) Selected frames from all leaders simulation. Magenta tracks and green arrowheads indicate leaders; green arrows and cyan tracks follower cells. Asterisks indicate cells crossing somite borders. White line marks dorsal midline. Anterior to the left, dorsal up. Time in minutes.
Notch activity allocates trunk neural crest (TNC) migratory identity.