IMAGE

Figure 2

ID
ZDB-IMAGE-220515-18
Source
Figures for Park et al., 2022
Image
Figure Caption

Figure 2 Time evolution and final state are self-consistent.

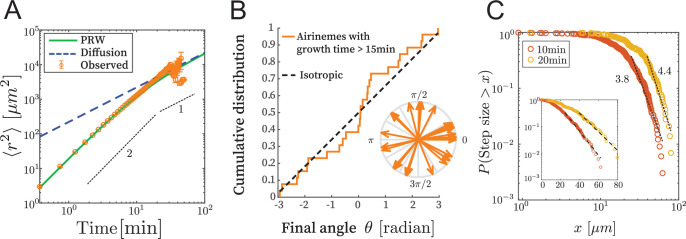
Each panel shows the examination of a single representative airineme as it emerges from the source cell at t=0, large star. Every 10 min, the shape is tracked at discrete points as it grows away from the source cell. The micrograph of the final length is shown as an inset (only the channel labeling the source cell is shown, so the target cells are not visible). Scale bar is in 20 µm. We computed root mean squared curvature of both the time-series tip location and of just the final state for the airinemes shown here. These two methods yield a difference, on average, of 0.7%. Thus, we conclude that the shape of the part of the airineme already existing at time t does not significantly change after time t as the tip of the airineme continues to extend.

Acknowledgments
This image is the copyrighted work of the attributed author or publisher, and ZFIN has permission only to display this image to its users. Additional permissions should be obtained from the applicable author or publisher of the image. Full text @ Elife