
|
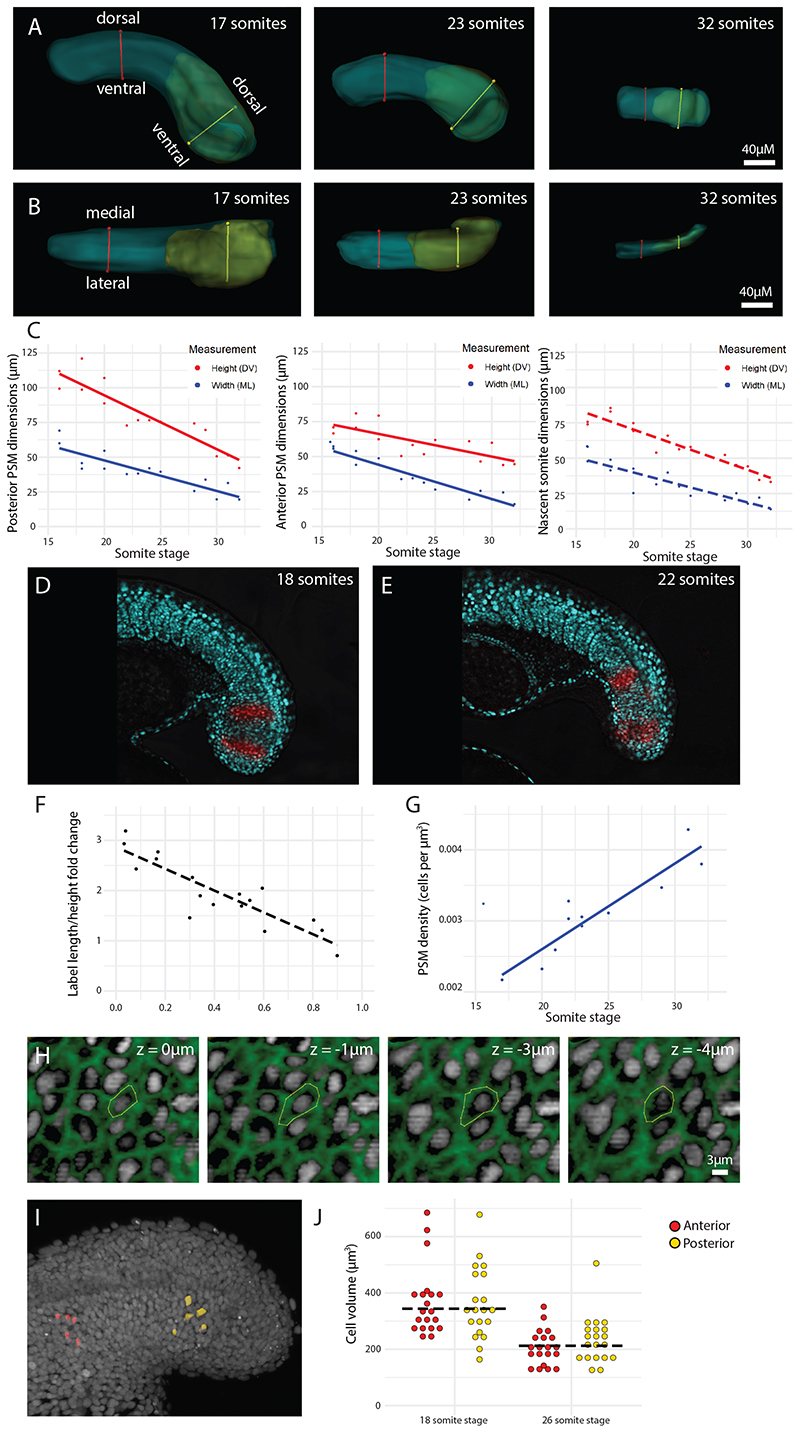
Figure 2
(A-B) Height (DV axis) (A) and width (ML axis) (B) measurements were taken of the posterior PSM (yellow line), anterior PSM (red line), and nascent somite (not shown) from the 16 somite-stage to the end of somitogenesis. (C) All height and width measurements show a decrease over the course of somitogenesis (n = 15 embryos). Solid trendlines indicate genuine change of one tissue (PSM) over time, whereas dotted trendlines indicate a trend based on separate tissues (nascent somites). The trendline equations are as follows (where