
Fig. 4
- ID
- ZDB-IMAGE-220512-28
- Genes
- Publication
- Capon et al., 2022 - Endocardial identity is established during early somitogenesis by Bmp signalling acting upstream of npas4l and etv2
- All Figures
- Figures for Capon et al., 2022
|
Fig. 4
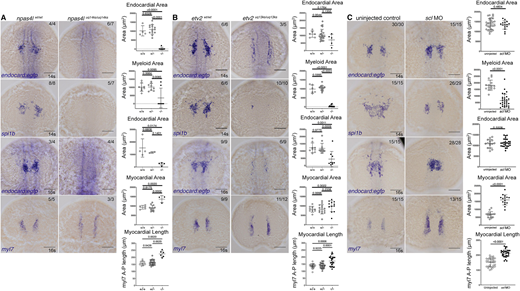
Gt(endocard:egfp) expression is reduced in npas4l and etv2 mutants. (A-C) In situ hybridisation for endocard:egfp and spi1b expression at 14 s and endocard:egfp and myl7 expression at the 16 s in npas4luq14ks mutants (A), etv2uq13ks mutants (B) and scl morphants (C). Quantification of the expression domain was measured by calculating the surface area of the stain or the length of the staining domain. These measurements are shown in adjacent graphs, where wild-type (+/+), heterozygous (+/−) and mutant (−/−) quantification is depicted for npas4luq14ks and etv2uq13ks mutants and siblings, and uninjected or morphant treatment for scl. Dorsal views, with anterior to the top. Scale bars: 100 μm. Data are mean±s.d. P-values are present in graphs were calculated using a one-way ANOVA (for npas4l and etv2 mutant analysis) or an unpaired two-tailed t-test (for scl MO analysis).