IMAGE

Figure 3.

ID
ZDB-IMAGE-220430-23
Source
Figures for Xue et al., 2022
Image
Figure Caption

Figure 3.

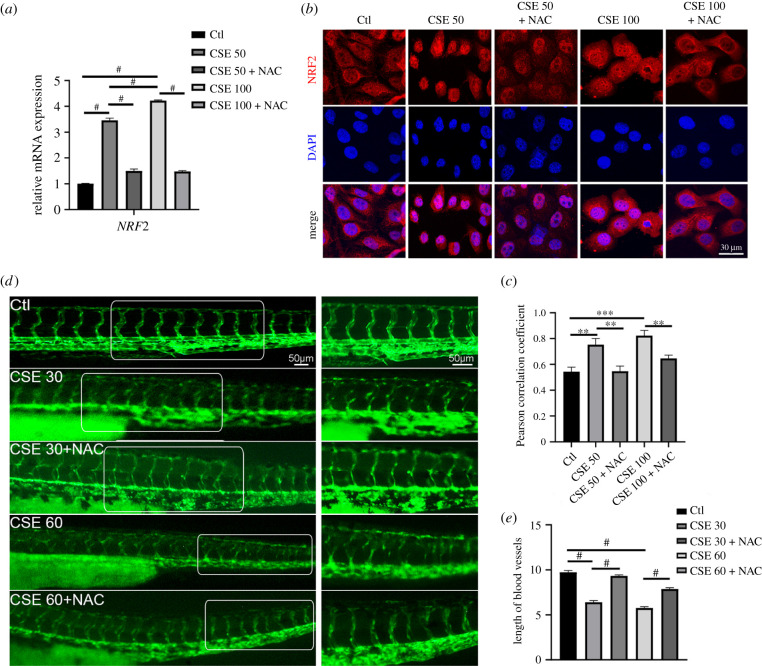
Elimination of ROS accumulation rescued the disrupted blood vessel. (a) The NRF2 mRNA expression level was examined in HUVECs exposed to different CSE concentrations with or without NAC (1 mM) for 24 h. (b) Representative images indicated NRF2 nuclear localization from different treated groups. (c) Pearson correlation coefficient for the co-localization of NRF2 and DAPI. (d) Representative images for the flk::GFP zebrafish with or without NAC (5 mM) under different concentrations of CSE. (e) Blood vessel lengths were quantified for different treatments (n = 16). Data presented are the mean ± s.e.m. Unpaired Student's t-test, #p < 0.0001, ***p < 0.001, **p < 0.01, *p < 0.05.

Acknowledgments
This image is the copyrighted work of the attributed author or publisher, and ZFIN has permission only to display this image to its users. Additional permissions should be obtained from the applicable author or publisher of the image. Full text @ Open Biol.