
Image
|
Figure Caption
Figure 5
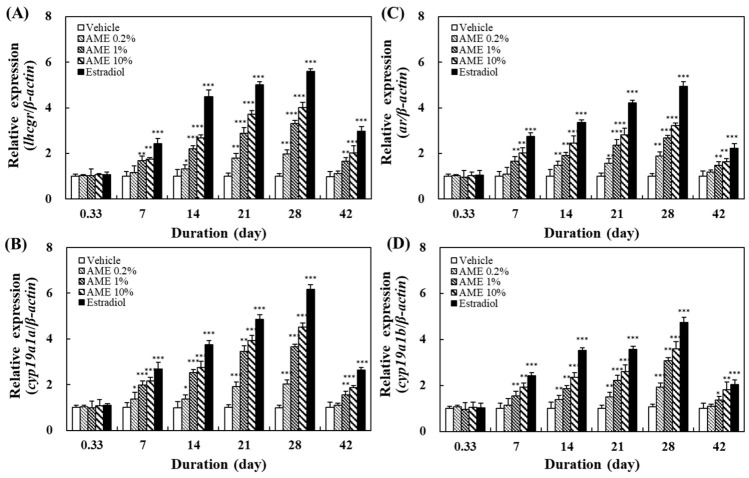
Figure 5. Effects of AME stimulation on the expression of sex-related genes in zebrafish: (A) female, lhcgr in ovaries; (B) female, cyp19a1a in the brain; (C) male, ar in the testes; (D) male, cyp19a1b in the brain. Five adult zebrafish were used for each experimental group at each sampling time. Statistical differences in gene expression between the AME-supplemented-diet group and the vehicle group were tested using one-way ANOVA, and levels of significance are denoted as * p < 0.05, ** p < 0.01, and *** p < 0.001.
Acknowledgments
This image is the copyrighted work of the attributed author or publisher, and
ZFIN has permission only to display this image to its users.
Additional permissions should be obtained from the applicable author or publisher of the image.
Full text @ Molecules