
Fig. 5
- ID
- ZDB-IMAGE-220411-2
- Antibodies
- Publication
- Abrial et al., 2022 - Latent TGFβ binding proteins 1 and 3 protect the larval zebrafish outflow tract from aneurysmal dilatation
- All Figures
- Figures for Abrial et al., 2022
|
Fig. 5
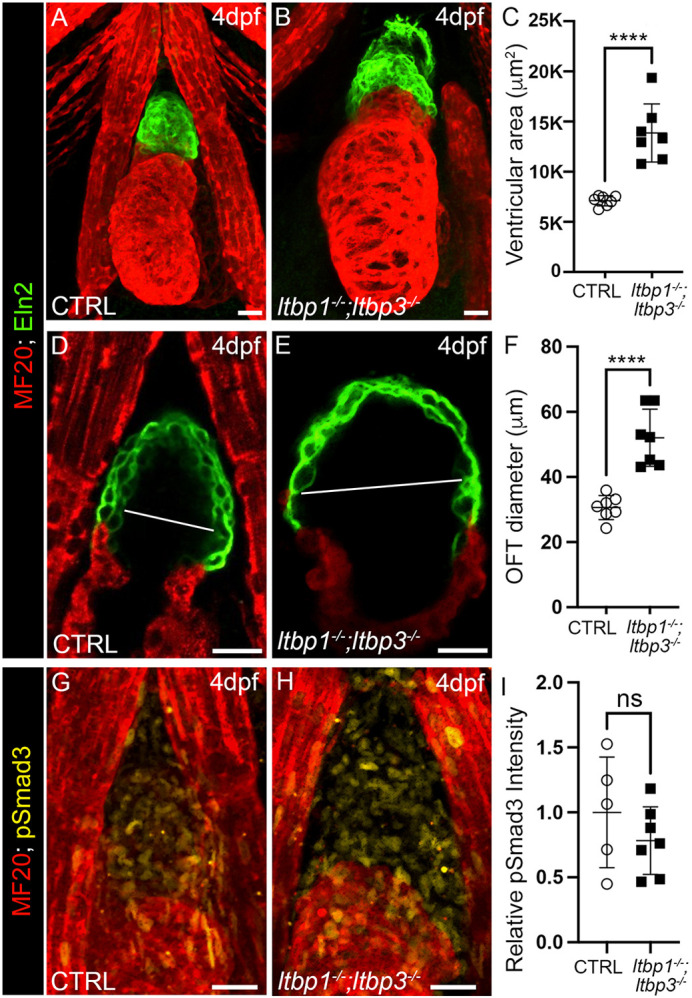
OFT aneurysm and ventricular dilation precede hyperactivation of TGFβ signaling in ltbp1, ltbp3 DKO larvae. (A,B) Confocal images of hearts in 4 dpf control (CTRL; A) and ltbp1−/−; ltbp3−/− (B) larvae double immunostained for striated muscle (MF20, red) and Eln2-positive OFT smooth muscle (green). (C) Dot plot showing the ventricular areas of 4 dpf CTRL (n=7) and ltbp1−/−; ltbp3−/− (n=7) larvae. (D,E) Single optical sections through the OFTs of 4 dpf CTRL (D) and ltbp1−/−; ltbp3−/− (E) larvae double immunostained for striated muscle (MF20, red) and Eln2-positive OFT smooth muscle (green). The white lines highlight the maximal OFT diameters between the walls of Eln2-positive smooth muscle. (F) Dot plot showing the maximal OFT diameters in 4 dpf CTRL (n=7) and ltbp1−/−; ltbp3−/− larvae (n=7). (G,H) Confocal images of OFTs in 4 dpf CTRL (G) and ltbp1−/−; ltbp3−/− (H) larvae double immunostained for striated muscle (MF20, red) and phosphorylated Smad3 (pSmad3, green). Dot plot showing the relative mean pSmad3 fluorescence intensities in the OFTs of 4 dpf CTRL (n=5) and ltbp1−/−; ltbp3−/− (n=7) larvae. For all dot plots, statistical significance was determined with an unpaired t-test. Error bars indicate one standard deviation. ****P<0.0001. ns, not significant. Scale bars: 20 µm.