
IMAGE
Fig. 6
- ID
- ZDB-IMAGE-220409-6
- Publication
- Monroe et al., 2022 - Identification of novel lipid biomarkers in xmrk- and Myc-induced models of hepatocellular carcinoma in zebrafish
- All Figures
- Figures for Monroe et al., 2022
Image
|
Figure Caption
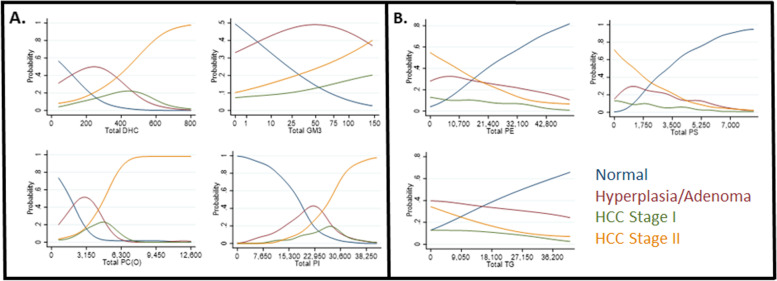
Fig. 6
Total lipid class level association with HCC disease stage. Univariate modeling shows the probability that individual total lipid class levels are associated with normal or disease stage phenotypes. Plots show total lipid levels versus probability of disease progression.
Acknowledgments
This image is the copyrighted work of the attributed author or publisher, and
ZFIN has permission only to display this image to its users.
Additional permissions should be obtained from the applicable author or publisher of the image.
Full text @ Cancer Metab