
Figure 1
- ID
- ZDB-IMAGE-220402-44
- Genes
- Publication
- Chen et al., 2022 - Loss of atm in Zebrafish as a Model of Ataxia-Telangiectasia Syndrome
- All Figures
- Figures for Chen et al., 2022
|
Figure 1
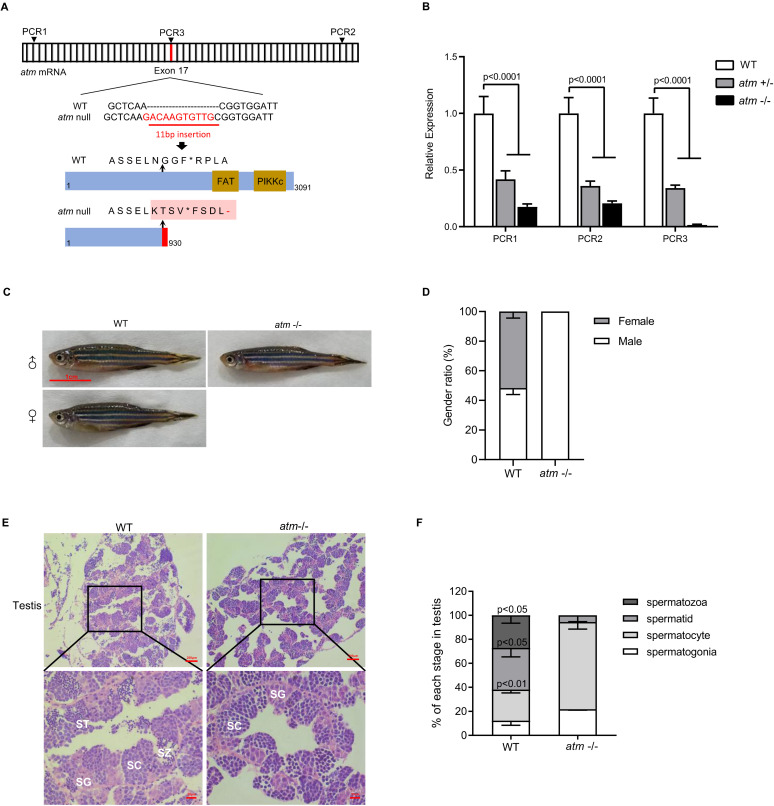
Mutant schema of atm and infertility phenotype. (A) Cas9-based engineering system of the atm introduced a stop code before functional domain. (B) Relative expression level of atm mRNA at different location (shown in (A)) of atm+/− and atm−/− zebrafish compared to WT (n = 3). (C) General observation of wild-type and atm−/− zebrafish at 6 months old. (D) Gender ratio of atm−/− compared with WT zebrafish (Over 50 fish each group were calculate). (E) HE stains of testis. SG, spermatogonia; SC, spermatocyte; ST, spermatid; SZ, spermatozoa. (F) Ratio of each stage of meiosis in atm−/− zebrafish testis compared to WT (n = 3). The statistical significance was analyzed using the two-tailed Student’s t-test. Data are shown as means ± SEM.