IMAGE

Fig. 2

ID
ZDB-IMAGE-220402-4
Genes
Source
Figures for Frisk et al., 2022
Image
Figure Caption

Fig. 2

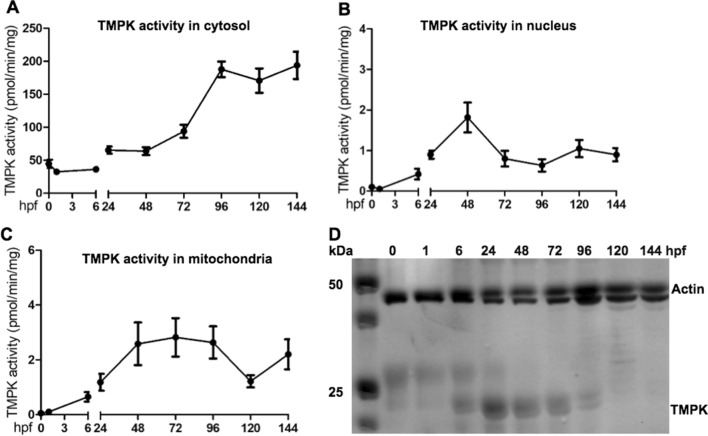
The levels of TMPK at different developmental stages. TMPK activity in the cytosol (A), nucleus (B) and mitochondria (C). D TMPK protein levels in cytosolic fractions. Cytosolic, mitochondrial and nuclear fractions were isolated from zebrafish at 0, 6, 24, 48, 72, 96, 120 and 144 h post fertilization (hpf). Total protein was extracted from these fractions and used to measure TMPK activity by using [3 H]-dTMP as substrate and the data was plotted as mean ± SD. TMPK protein levels was assessed by western blot analysis using a specific antibody designed against zebrafish canonical TMPK and only the relevant part of the full image is shown

Figure Data
Acknowledgments
This image is the copyrighted work of the attributed author or publisher, and ZFIN has permission only to display this image to its users. Additional permissions should be obtained from the applicable author or publisher of the image. Full text @ BMC Neurosci.