
Fig. 2
- ID
- ZDB-IMAGE-220328-6
- Publication
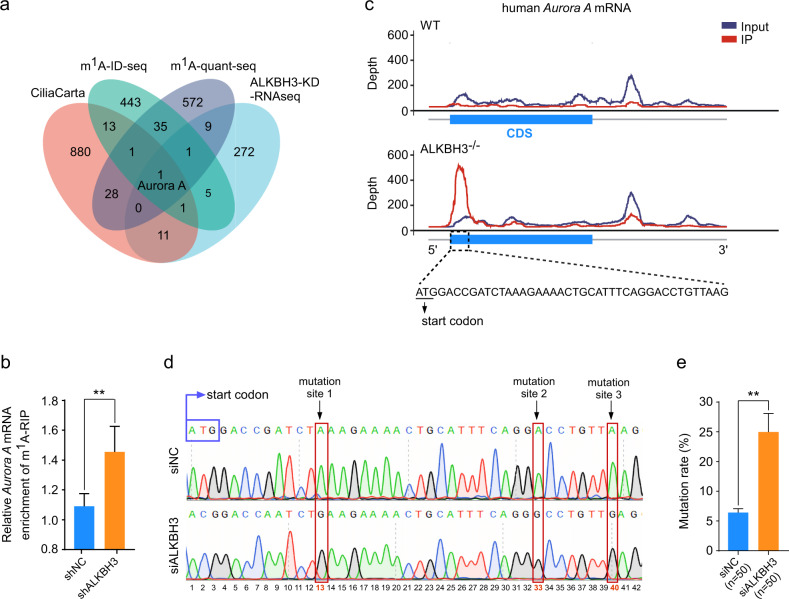
- Kuang et al., 2022 - ALKBH3-dependent m1A demethylation of Aurora A mRNA inhibits ciliogenesis
- All Figures
- Figures for Kuang et al., 2022
|
Fig. 2