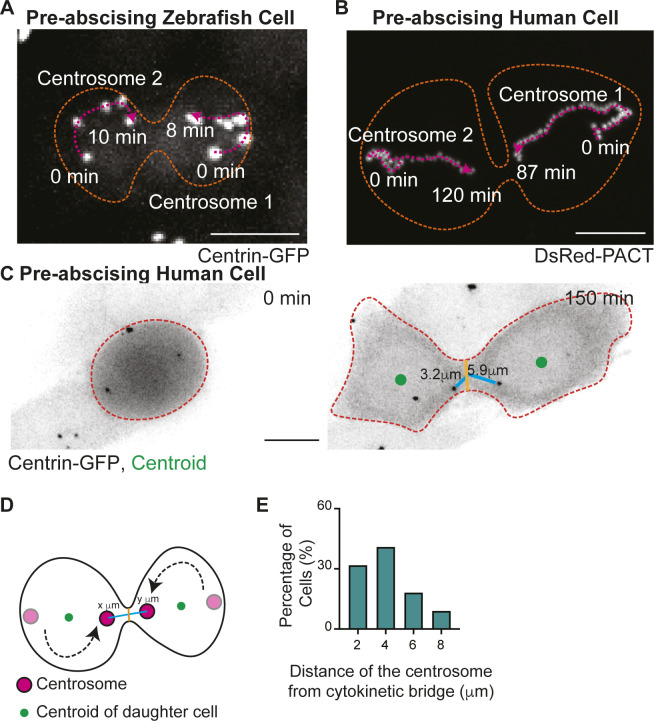
Differences in mitotic centrosome movement towards the cytokinetic bridge during pre-abscission between zebrafish embryos and human cells.
(A, B) Overlay of centrosome movement within pre-abscising zebrafish embryo cell (A) and human (HeLa) cell (B) over time. The centrosome is labeled with centrin-GFP (zebrafish embryo cell, gray) and DsRed-PACT (human HeLa cell, gray). Pink dashed line with arrow, centrosome track. Orange dashed lines, cell boundaries. Scale bar, 10 μm. (C) Time-lapse of a pre-abscising human (HeLa) cell expressing centrin-GFP (inverted grays). Green dot, centroid of cell. Orange dashed lines, cell boundaries. Brown line, width of the cytokinetic bridge. Cyan line, distance of the centrosome from the midpoint of the cytokinetic bridge (μm). Scale bar, 10 μm. (D) Model depicting quantification related to centrosome movement towards the cytokinetic bridge. Magenta circle, centrosomes. Black line, cell boundaries. Brown line, width of the cytokinetic bridge. Cyan line, distance of the centrosome from the midpoint of cytokinetic bridge (μm). (E) Percentage of pre-abscising cells (%) that moves the centrosome to at least 2, 4, 6, and 8 μm from the midway point of the cytokinetic bridge.
Acknowledgments
This image is the copyrighted work of the attributed author or publisher, and
ZFIN has permission only to display this image to its users.
Additional permissions should be obtained from the applicable author or publisher of the image.
Full text @ Life Sci Alliance
Your Input Welcome
Thank you for submitting comments. Your input has been emailed to ZFIN curators who may contact you if
additional information is required.
Oops. Something went wrong. Please try again later.