
Image
|
Figure Caption
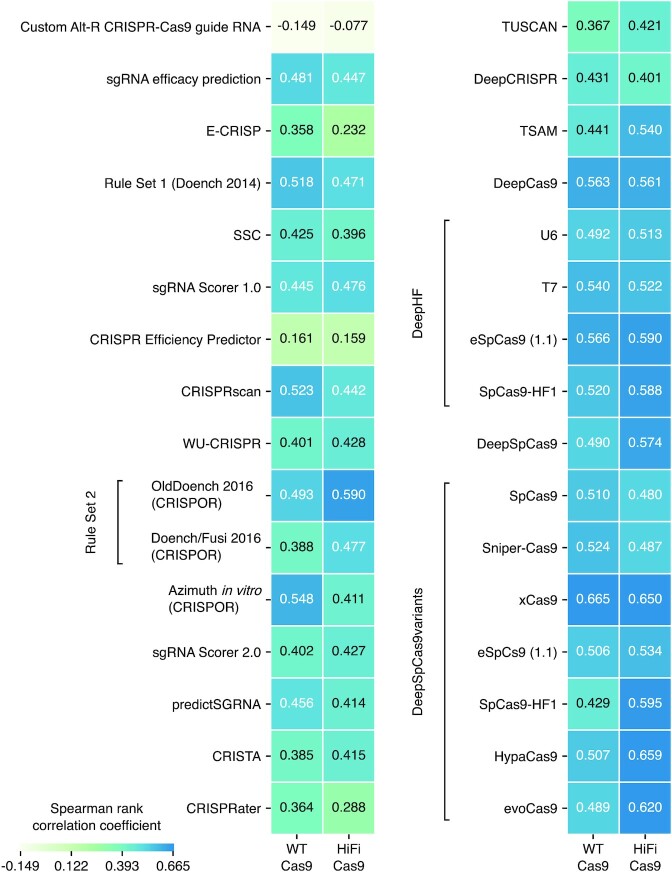
Figure 7.
Predictive power of current CRISPR-Cas9 gRNA design tools for dgRNA/Cas9 RNPs. The heat map shows Spearman rank correlation coefficients (
Acknowledgments
This image is the copyrighted work of the attributed author or publisher, and
ZFIN has permission only to display this image to its users.
Additional permissions should be obtained from the applicable author or publisher of the image.
Full text @ Nucleic Acids Res.