
Fig 2
- ID
- ZDB-IMAGE-220318-3
- Genes
- Publication
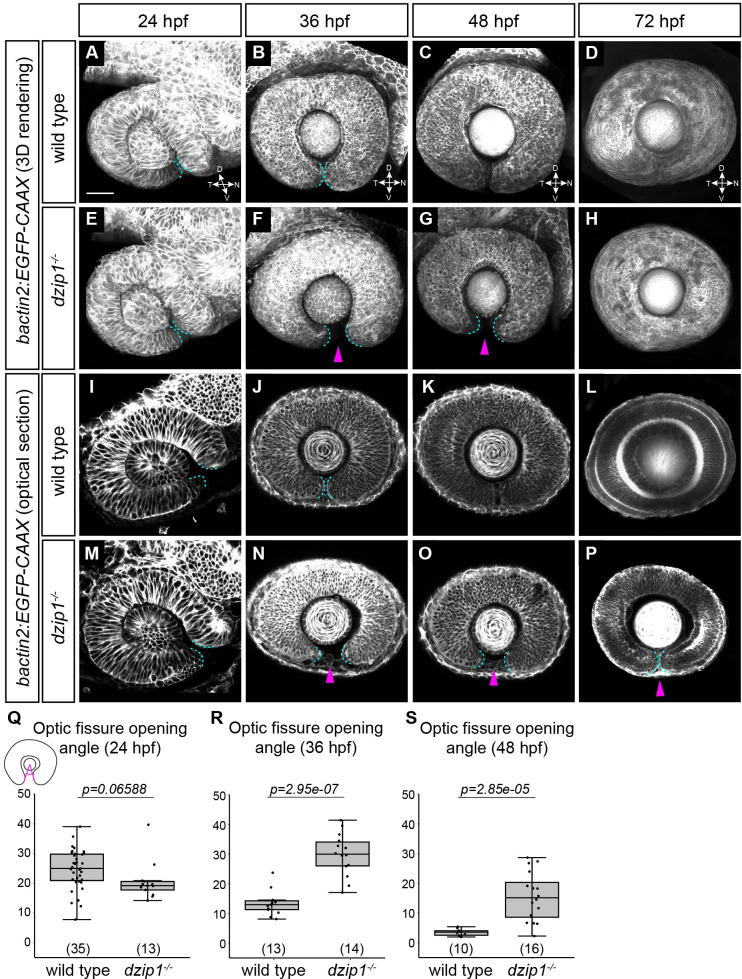
- Nandamuri et al., 2022 - Loss of zebrafish dzip1 results in inappropriate recruitment of periocular mesenchyme to the optic fissure and ocular coloboma
- All Figures
- Figures for Nandamuri et al., 2022
|
Fig 2
(A-P) Wild type (A-D, I-L) and