
Fig. 2
- ID
- ZDB-IMAGE-220311-12
- Genes
- Publication
- Soto et al., 2021 - Sequential regulation of hemogenic fate and hematopoietic stem and progenitor cell formation from arterial endothelium by Ezh1/2
- All Figures
- Figures for Soto et al., 2021
|
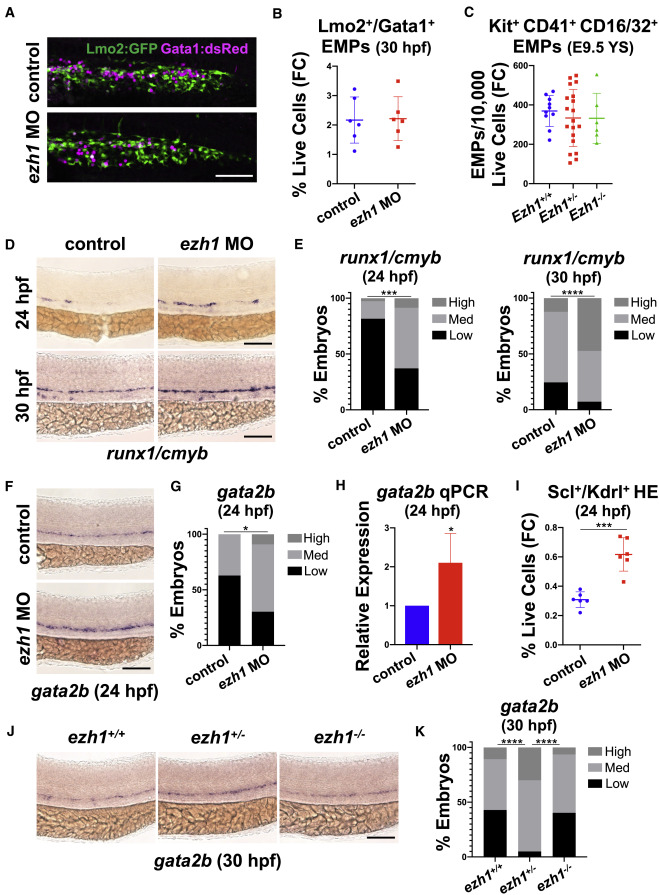
Fig. 2 (A) Confocal imaging of Lmo2:GFP+/Gata1:dsRed+ in the PBI at 30 hpf in control and ezh1 morphants. Scale bar, 50 μm. (B) Flow cytometry (FC) for Lmo2:GFP+/Gata1:dsRed+ gated on percentage of live cells at 30 hpf in control and ezh1 morphants (n = 5 embryos/sample × 6 biological replicates; two-tailed unpaired Student's t test, not significant. Error bars indicate SD). (C) Flow cytometry (FC) for Kit+CD41+CD16/32+ gated on 10,000 live cells derived from E9.5 yolk sacs (YS) from Ezh1+/+, Ezh1+/−, Ezh1−/− mouse embryos (n ≥ 6 yolk sacs/genotype; one-way ANOVA, not significant. Error bars indicate SD). (D) WISH for runx1/cmyb at 24 and 30 hpf in control and ezh1 morphants. Scale bar, 100 μm. (E) Qualitative phenotypic distribution plot of embryos in (D) (n ≥ 60 embryos/condition; ∗∗∗p < 0.001, ∗∗∗∗p < 0.0001). (F) WISH for gata2b at 24 hpf in control and ezh1 morphants. Scale bar, 100 μm. (G) Qualitative phenotypic distribution plot of embryos in (F) (n = 35 control, 33 ezh1 morphants; ∗p < 0.05). (H) Whole-embryo gata2b qPCR on control and ezh1 morphants at 24 hpf relative to 18s (n ≥ 25 embryos/sample × 4 replicate clutches; two-tailed unpaired Student's t test, ∗p < 0.05. Mean ± SEM). (I) Flow cytometry (FC) on Scl:GFP+/Kdrl:mCherry+ gated on percentage of live cells at 24 hpf in control and ezh1 morphants (n = 5 embryos/sample × 6 biological replicates; two-tailed unpaired Student's t test, ∗∗∗p < 0.001. Error bars indicate SD). (J) WISH for gata2b in ezh1+/+, ezh1+/−, ezh1−/− embryos at 30 hpf. Scale bar, 100 μm. (K) Qualitative phenotypic distribution plot of embryos in (J) (n ≥ 40 embryos/genotype; ∗∗∗∗p < 0.0001).