
Image
|
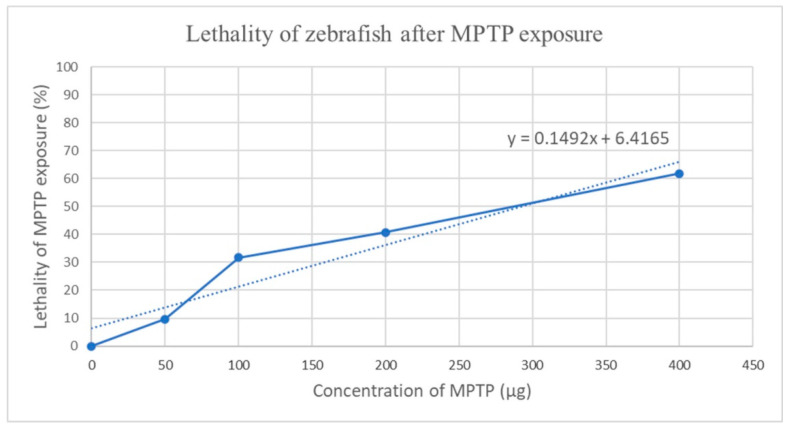
Figure Caption
Figure 2 LD50 values calculated using the linear regression of the constructed curves, based on the graphical method of Miller and Tainter in the Excel software.
Acknowledgments
This image is the copyrighted work of the attributed author or publisher, and
ZFIN has permission only to display this image to its users.
Additional permissions should be obtained from the applicable author or publisher of the image.
Full text @ Toxics