
|
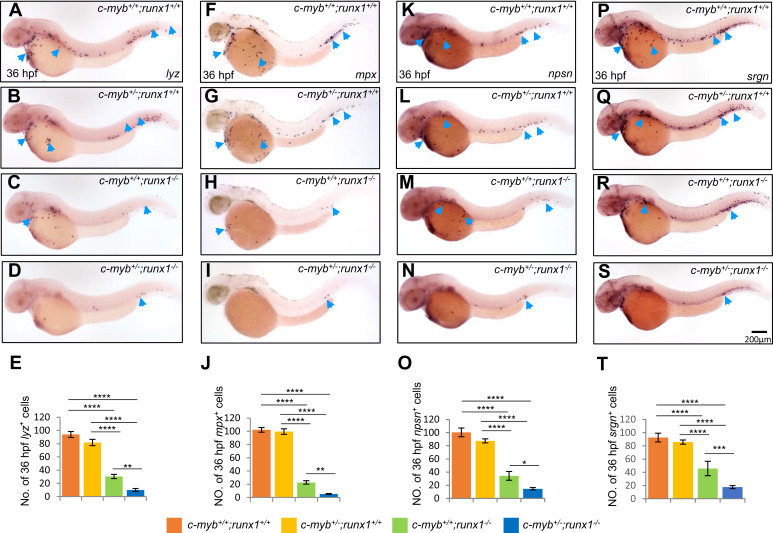
Fig. 3 Genetic interaction between c-myb and runx1 on neutrophil-specific genes. A–D, WISH showed further decrease of lyz expression in 36-hpf double mutants (D) compared with single mutants (B and C). E, quantification of numbers of 36-hpf lyz+ cells (each n ≥ 16). F–J, WISH showed further decrease of mpx+ cells in 36-hpf double mutants (I) compared with single mutants. J, quantification of numbers of 36-hpf mpx+ cells (each n ≥ 20). K–N, WISH showed further decrease of npsn+ cells in 36-hpf double mutants (N) compared with single mutants. O, quantification of numbers of 36-hpf npsn+ cells (each n ≥ 8). P–S, WISH showed further decrease of srgn+ cells in 36-hpf double mutants (S) compared with single mutants. T, quantification of numbers of 36-hpf srgn+ cells (each n ≥ 8). Blue arrowheads indicate lyz+, mpx+, srgn+, and npsn+ neutrophils in each row. Scale bars, 200 μm.