
|
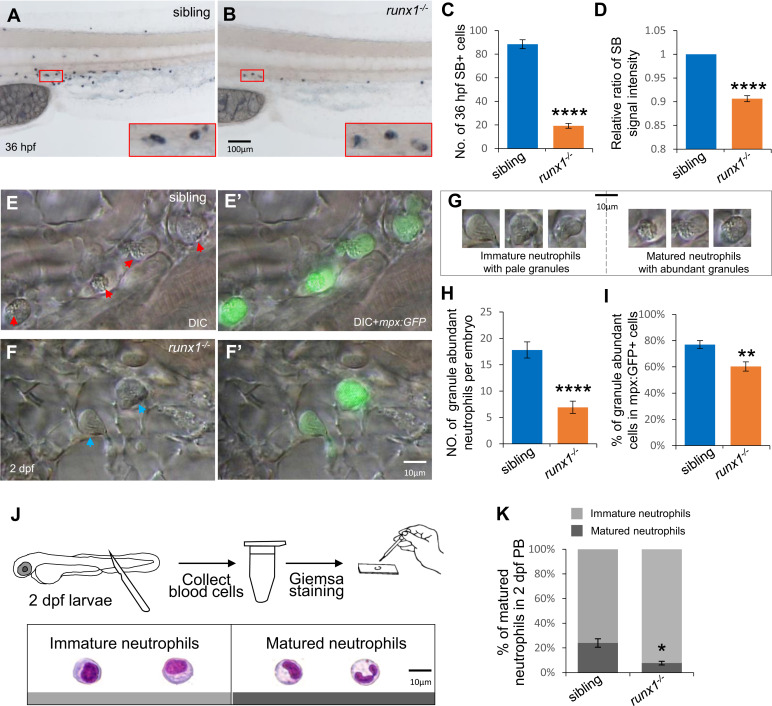
Fig. 1 Neutrophil maturation was affected by runx1w84x mutation. A–D, SB staining showed decrease number and intensity of SB+ cells in 36-hpf runx1−/− mutants (B) compared with siblings. Red boxes show enlarged detail of SB+ cells in each group (×4). C, quantification of numbers of 36-hpf SB+ cells (each n ≥ 22). Neutrophils were counted based on the SB signals of the whole embryos. D, relative ratio of SB signal intensity was calculated in runx1 mutants and siblings. E–H, granule status in mpx:GFP+ neutrophils. (E, F, E’ and F’) In vivo VE DIC microscopy revealed reduction of granules in neutrophils in 2-dpf runx1 mutants (F and F’) compared with siblings (E and E’) in Tg(mpx:GFP) background (each n ≥ 22). Left panels are bright field DIC images. Right panels are overlays of bright field DIC images with corresponding GFP fluorescent images. Red arrowheads indicate matured neutrophils. Blue arrowheads indicate immature neutrophils. G, representative images of matured neutrophils with abundant granules and immature neutrophils with pale granules. H and I, quantification of absolute numbers of granule-abundant neutrophils per embryo (H) and relative percentage of granule-abundant cells in total mpx:GFP+ neutrophils (I). J and K, May–Grünwald–Giemsa staining of neutrophils in 2-dpf embryos (J) and neutrophils were quantitated by morphology (K). Gray and dark gray represent immature and mature neutrophils by their nucleic morphology. Scale bars, 100 μm (A and B), and 10 μm (E, F, E’, F’, G, and J).