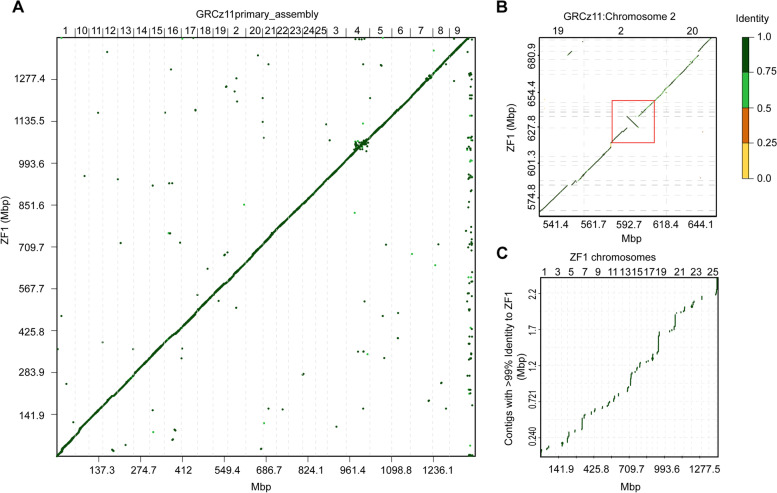
IMAGE

Fig. 4

ID
ZDB-IMAGE-220215-5
Source
Figures for Chernyavskaya et al., 2022
Image
Figure Caption

Fig. 4

Association plots of similarities and differences between ZF1 assembly and GRCz11 primary assembly. A Entire de novo generated ZF1 assembly compared to GRCz11. Center, diagonal line marks strong association and alignments with shorter indels placed off-center of the diagonal (B) Magnified area on Chr 2 showing an 8.5Mbp inversion (red box) in ZF1 deviating from GRCz11. C Chromosomal placement of unlocalized contigs of GRCz11 bearing at least 99% similarity to ZF1. Color scale indicates percent similarity between alignments

Acknowledgments
This image is the copyrighted work of the attributed author or publisher, and ZFIN has permission only to display this image to its users. Additional permissions should be obtained from the applicable author or publisher of the image. Full text @ BMC Genomics