
Image
|
Figure Caption
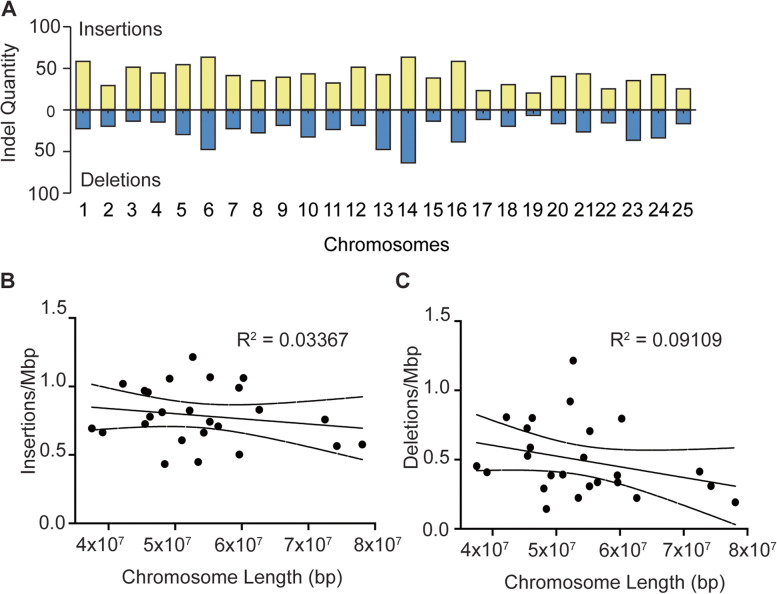
Fig. 5 Novel indel distribution in ZF1 assembly. A Frequency of insertions (yellow) and deletions (blue) identified in ZF1 assembly across all chromosomes. B-C Dot plots showing lack of correlation between indel frequency and chromosome length. R value cutoff for correlation was set to 0.6
Acknowledgments
This image is the copyrighted work of the attributed author or publisher, and
ZFIN has permission only to display this image to its users.
Additional permissions should be obtained from the applicable author or publisher of the image.
Full text @ BMC Genomics