
Fig. 1
- ID
- ZDB-IMAGE-220212-2
- Publication
- Höijer et al., 2022 - CRISPR-Cas9 induces large structural variants at on-target and off-target sites in vivo that segregate across generations
- All Figures
- Figures for Höijer et al., 2022
|
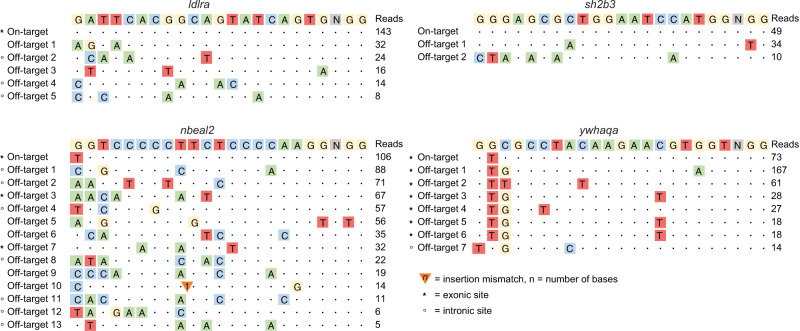
Fig. 1 The diagrams show Cas9 cleavage sites detected in vitro by Nano-OTS for the four gRNAs targeting ldlra, nbeal2, sh2b3, and ywhaqa. The sequence at the top of each diagram displays the gRNA sequence and PAM site (NGG). The rows below show the on-target site as well as the identified off-target sites. Colored letters correspond to single-nucleotide mismatches between the target site and the GRCz11 genome. Triangles are used to mark insertion mismatches, where nucleotides need to be inserted to match the reference genome. Asterisks and circles mark off-target sites located within exonic and intronic regions, respectively. The column to the right shows the number of reads in the Nano-OTS analysis for each target site.