
FIGURE 8
- ID
- ZDB-IMAGE-220205-24
- Publication
- Song et al., 2022 - Disruption of Epidermal Growth Factor Receptor but Not EGF Blocks Follicle Activation in Zebrafish Ovary
- All Figures
- Figures for Song et al., 2022
|
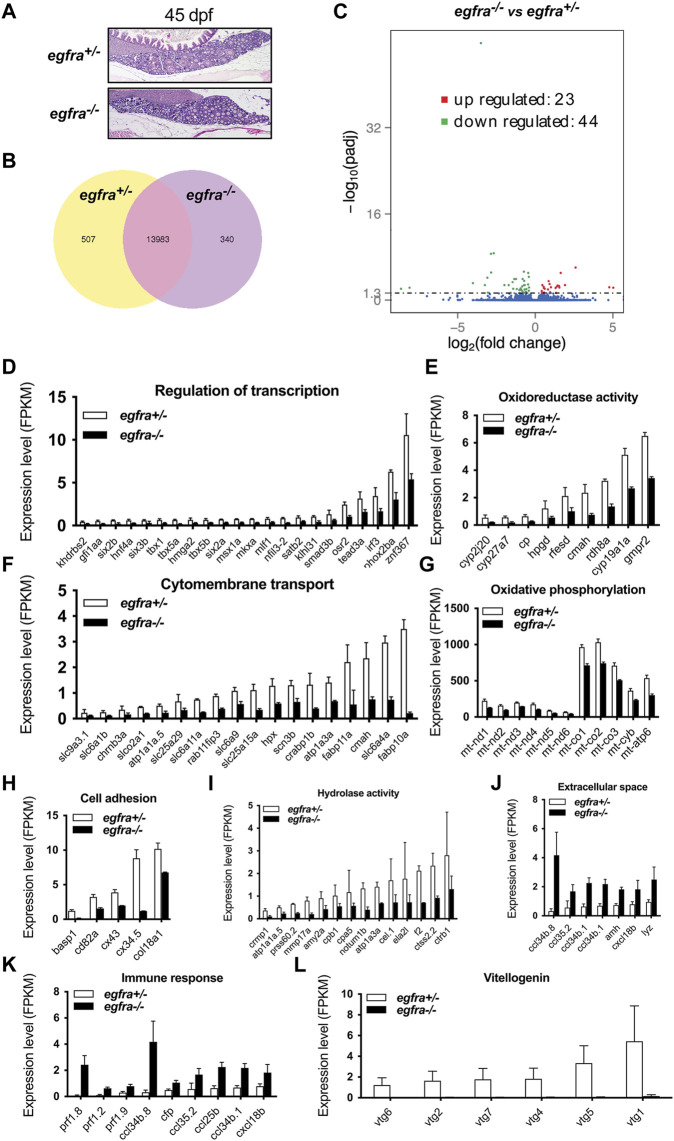
FIGURE 8 Transcriptome analysis for differentially expressed genes (DEG) in egfra−/− zebrafish ovary. (A) The ovaries of control (egfra+/−) and mutant (egfra−/−) at 45 dpf when follicle activation or PG-PV transition occurs. (B) Venn diagram illustrating DEGs in egfra+/− and egfra−/− ovaries. FPKM was used to normalize gene expression levels with FPKM >1 being the expression threshold. In total, 13,983 genes were expressed in the ovaries of both egfra+/− and egfra−/− fish, whereas 507 and 340 genes were only expressed in the ovaries of egfra+/− and egfra−/− fish, respectively. (C) MA plot showing the significantly downregulated (in green) and upregulated (in red) genes. (D–I) Enrichment of downregulated genes in transcription regulation, oxidoreductase activity, cytomembrane transport, oxidative phosphorylation (mitochondrial metabolic pathway), cell adhesion, and hydrolase activity. (J,K) Enrichment of upregulated genes in extracellular space and immune response. (L) Loss of expression of vitellogenin genes (vtg1, vtg2, vtg4, vtg5, vtg6, and vtg7) in mutant ovary follicles (egfra−/−). FPKM, fragments per kilobase million.