
Fig. 2
- ID
- ZDB-IMAGE-220131-408
- Publication
- Uribe-Salazar et al., 2022 - Evaluation of CRISPR gene-editing tools in zebrafish
- All Figures
- Figures for Uribe-Salazar et al., 2022
|
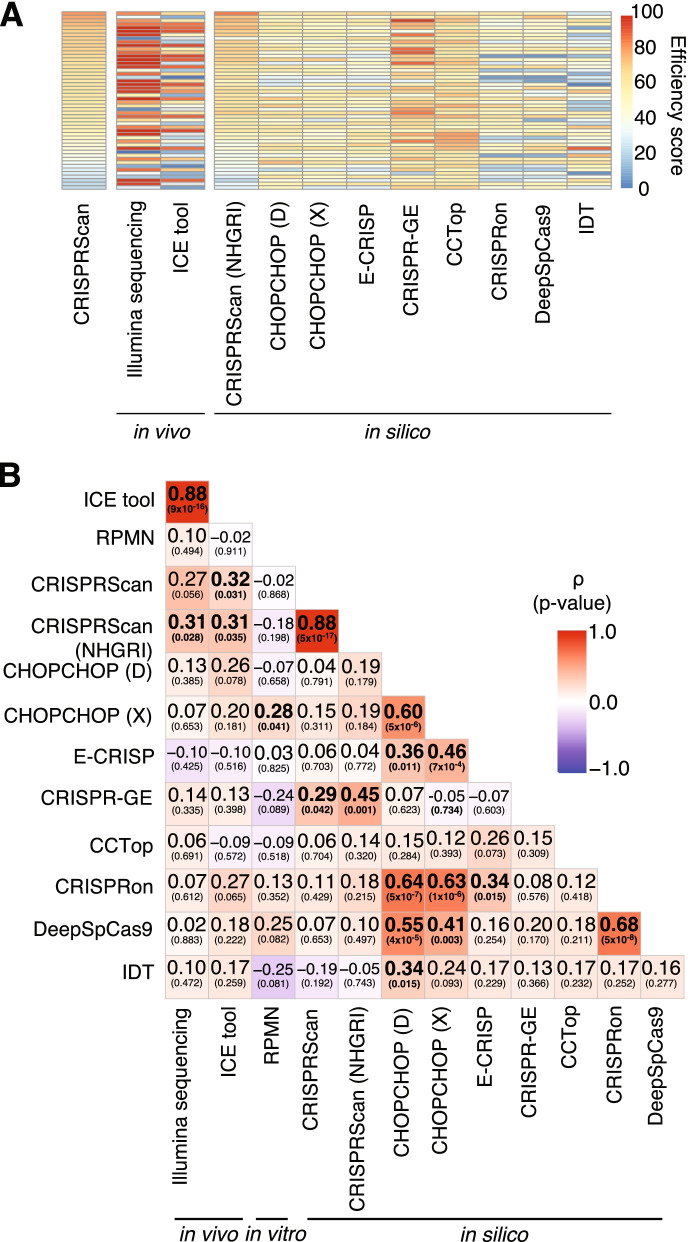
Fig. 2 Correlation of on-target efficiencies calculated using different methods. A Heatmap of the efficiency scores obtained from the design tool (CRISPRScan), in silico prediction tools, and cutting cleavages obtained in vivo using Illumina sequencing and a deconvolution tool from Sanger sequencing [35] for 50 gRNAs. Each box represents a gRNA and the efficiency scores range from 0 (blue) to 100 (red). B Spearman correlations between all efficiency scores from in silico predictions, an in vitro protocol [28], and in vivo cutting assays. Each box includes the correlation result with the p-value in parenthesis. The color of the boxes represent the correlation values, ranging between − 1 (blue) and 1 (red). CHOPCHOP scores were obtained using two different scoring methods, CHOPCHOP (D) (based on [39]) and CHOPCHOP (X) (based on [40])