
|
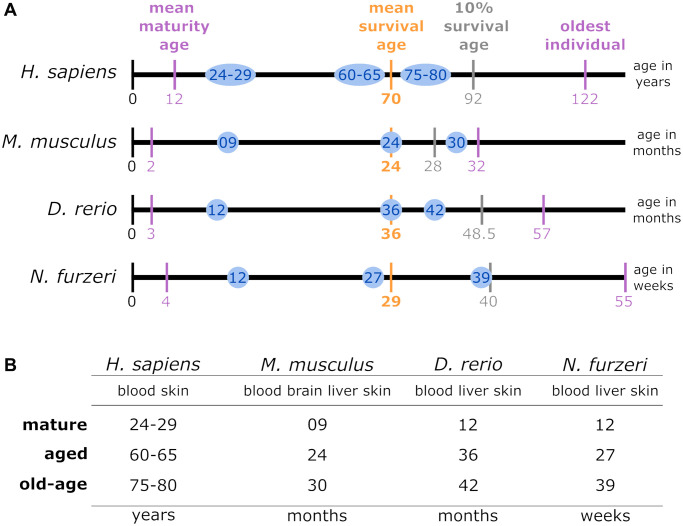
Figure 1
(A) Lifespan comparison: to align the species-specific chronological ages to biological age categories comparable between different species, the total individual’s lifetime, represented by the length of the lifetime axis, was subdivided by index stages. These stages were the biological stages corresponding to maturation, the mean survival age, the 10% survival rate, and the highest age reported for an individual belonging to the respective species. The time intervals between the resulting intersections were normalized linearly for the mean survival age. Thus, the sampling time points examined in this study for a specific species (blue circles) matched the biological age category in all the other species. (B) Data sampling scheme and categorization of the high-throughput transcriptomic data according to age parameters: for each of the 4 species of interest, up to 4 tissue types were sampled at mature, aged and old-age stages, from which 3 comparisons were deduced to identify DEGs during early aging (mature vs. aged), late aging (mature vs. old-age), and longevity (aged vs. old-age).