
Image
|
Figure Caption
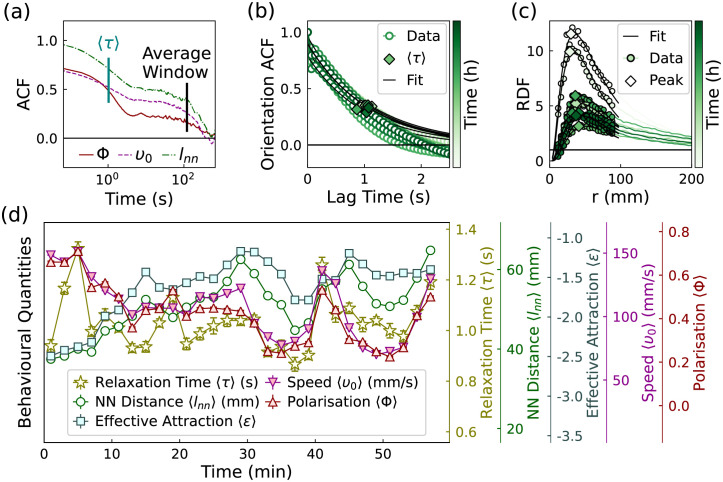
Fig 2 A: The auto–correlation function of the polarisation and average speed of the fish group. B: The auto–correlation function of the orientations of fish. C: Sequence of radial distribution functions with increasing time: at early times (top curves) the fish are clustered together so that the peak is large; at later times (bottom curves) the local density decreases and so does the peak height. D: The time evolution of the averaged behavioural quantities for 50 young fish. Each point corresponds to the average value in 2 minutes. The error bars illustrate the standard error values
Acknowledgments
This image is the copyrighted work of the attributed author or publisher, and
ZFIN has permission only to display this image to its users.
Additional permissions should be obtained from the applicable author or publisher of the image.
Full text @ PLoS Comput. Biol.