
|
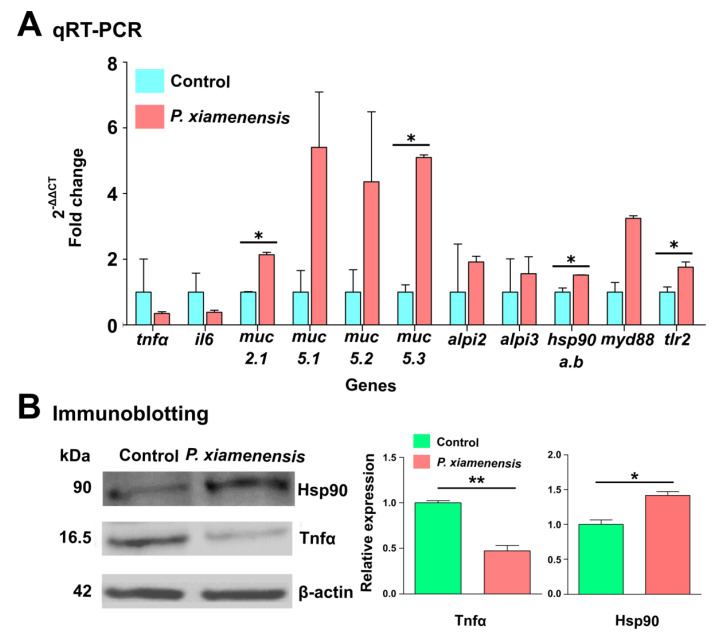
Figure 4
qRT-PCR and immunoblotting analysis of P. xiamenensis-treated zebrafish larvae. (A) The effect of P. xiamenensis treatment on immune-related genes at the mRNA level using qRT-PCR. Gene expression profiles were determined in non-treated control and P. xiamenensis-treated zebrafish treatment groups. Asterisk (*) indicates a significant difference compared to the non-treated control. Significance was set at p < 0.05. (B) Immunoblot analysis of Hsp90 and Tnfα in P. xiamenensis-treated zebrafish larvae, compared to the non-treated control. Expression levels of β-actin were set as the normalizing control. The intensity of each protein band was measured by Image J software. Asterisk (*) indicates a significant difference compared to the control group (* p < 0.05, ** p < 0.01). Statistical significance was set at p < 0.05.