
|
Figure 3
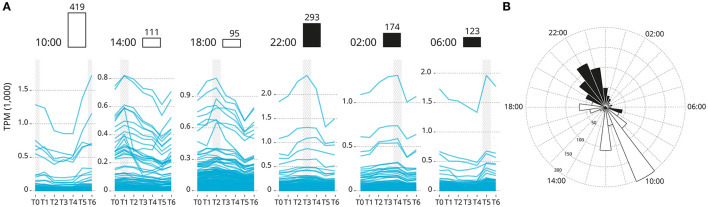
Genes groups based on their acrophase (expression peak) synchronicity. (A) Based on the average recorded TPM values. The number of gene is reported over the barplot (white and black boxes denote light or darkness conditions, respectively). Sub-figures exclude three highly expressed genes that bias the scale of the graphic: Ependymin-1 (> 10,000 TPM) Ependymin-2 (> 5,000 TPM) and calcium voltage-gated channel auxiliary subunit alpha 2 delta 4 (> 2,000 TPM). (B) Rose plot of the phase distribution of highly significantly circadian gene expression (p < 0.001, JTK analysis). Color coding indicates whether the phase occurs during the light (white) or dark (black) (12:12 LD).