
|
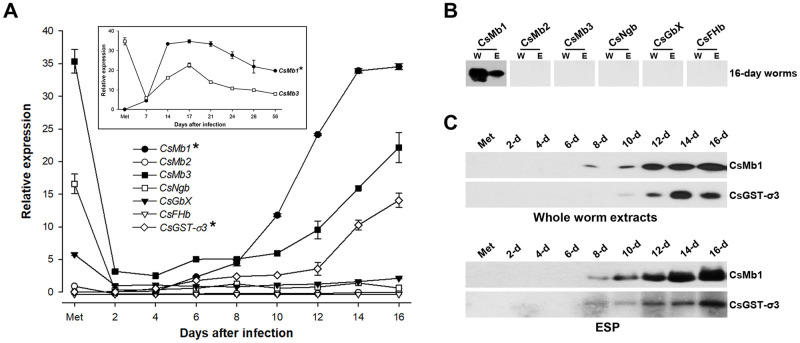
Fig 3
A. Induction profiles of the Clonorchis sinensis globin genes were assessed using a quantitative PCR (qPCR) method related to the development/maturation of the liver fluke from metacercariae to 16-day worms. The calculations are based on independent technical triplicates (n = 3, mean ± S.D.). In cases of the CsMb1 and CsMb3 genes, worms up to 56 days-old were included in the measurements (inset graph). The relative expressions of CsMb1 and CsGST-σ3 (marked by asterisks) are given in 1/1,000 of their original values in the graphs. B. Western blot analysis of the whole worm extracts (W, 30 μg/well) of C. sinensis adults and their excretory-secretory products [ESPs (E), 10 μg/well] with antibodies specific to C. sinensis globins. C. The temporal secretion profile of CsMb1 was similarly examined in the whole body extracts and the ESPs of C. sinensis worms from metacercaria to 16 days post-infection. The anti-CsGST-σ3 antibody was also included in the blotting analyses.