
Image
|
Figure Caption
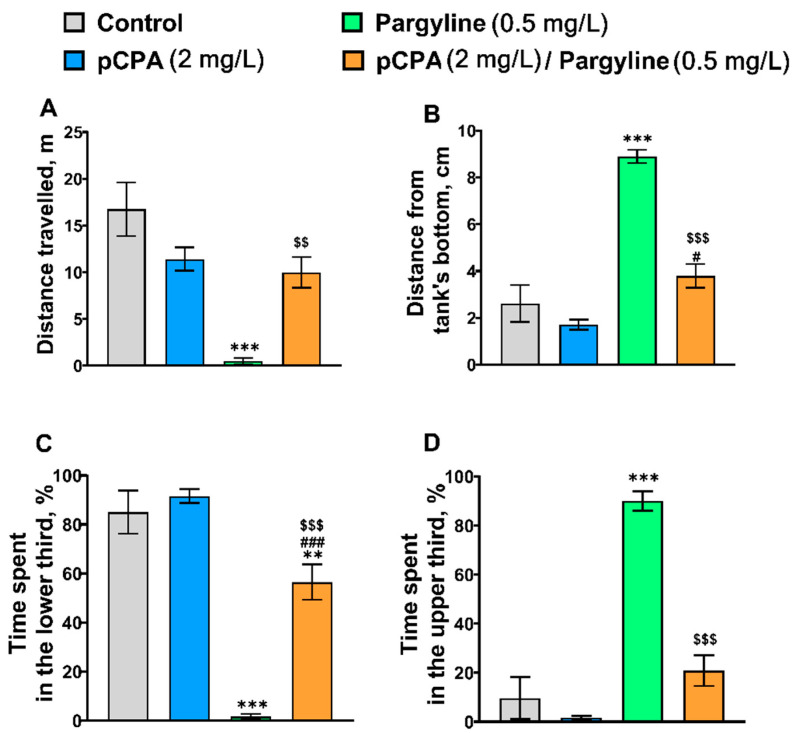
Figure 4 (A) Distance traveled (m), (B) mean distance from the tank’s bottom (cm), (C) time (%) spent in the lower and (D) the upper thirds in the novel tank diving test in control (water) zebrafish and those exposed for 72 h to pCPA (2 mg/L), pargyline (0.5 mg/L) or combination of pCPA (2 mg/L) and pargyline (0.5 mg/L), correspondently. The number of animals in each group was 10. ** p < 0.01; *** p < 0.001 vs. control group; # p < 0.05, ### p < 0.001 vs. pCPA treated group; $$ p < 0.01, $$$ p < 0.001 vs. pargyline treated group.
Acknowledgments
This image is the copyrighted work of the attributed author or publisher, and
ZFIN has permission only to display this image to its users.
Additional permissions should be obtained from the applicable author or publisher of the image.
Full text @ Int. J. Mol. Sci.