
Image
|
Figure Caption
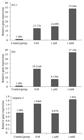
Fig. 2 Bax, bcl-2 and caspase-3 mRNA expression levels in zebrafish (Danio rerio) embryos for the control group and vitrified treatments with 0, 1 µM and 1 mM melatonin respectively obtained by the 2-ΔΔCT method. Boxes with same letter are not significantly different from one another (P > 0.05).
Acknowledgments
This image is the copyrighted work of the attributed author or publisher, and
ZFIN has permission only to display this image to its users.
Additional permissions should be obtained from the applicable author or publisher of the image.
Full text @ Braz. J. Biol.