
Figure 8
- ID
- ZDB-IMAGE-211201-179
- Antibodies
- Publication
- Chen et al., 2021 - Knockout of mafba Causes Inner-Ear Developmental Defects in Zebrafish via the Impairment of Proliferation and Differentiation of Ionocyte Progenitor Cells
- All Figures
- Figures for Chen et al., 2021
|
Figure 8
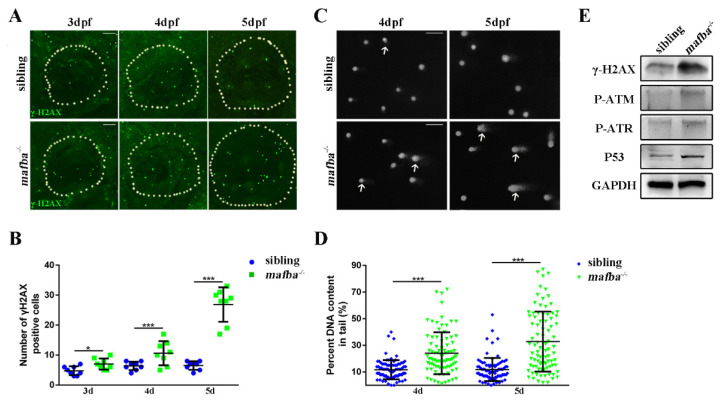
Analysis of the accumulation of DNA damage in mafba−/− mutants’ inner-ear. (A) Whole-mount immunofluorescence analysis using the anti-γH2AX antibody in siblings and mafba−/− inner-ear at 3, 4, and 5 dpf. The white, dotted circle represents the inner ear area. Scale bars: 20 µm. (B) Statistical analysis of the γH2AX-positive cells is shown in (A). (C) The alkaline comet assay showed increased DNA damage in mafba−/− embryos at 4 and 5 dpf. White arrows show DNA-damaged cells with single- or double-strand breaks. Scale bars: 10 µm. (D) Quantitative analysis of 88 cells from 10 embryos in siblings and mafba−/− group are shown. (E) Western blot analysis of γH2AX, P-ATM, P-ATR, and p53 in siblings and mafba−/− zebrafish at 4 dpf. GAPDH was used as the normalized protein control. Data are represented as mean ± SD; *, p < 0.05; ***, p < 0.001.