
Image
|
Figure Caption
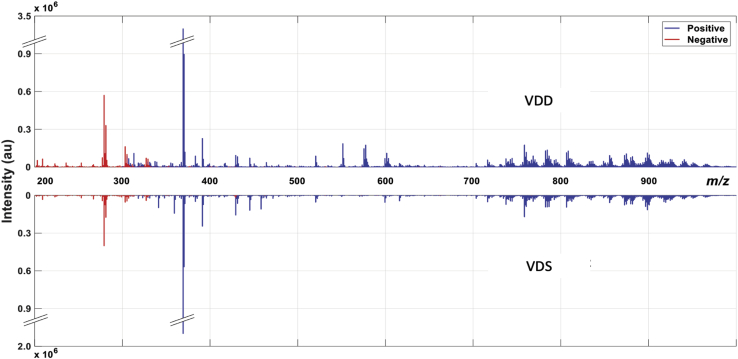
Fig. 1
Comparison of ROI lipid profiles from a VDD and VDS zebrafish. Mirror plots from full-scan MS1 spectra illustrate the chemical diversity and changes in lipid composition observed in VDD fish.
Acknowledgments
This image is the copyrighted work of the attributed author or publisher, and
ZFIN has permission only to display this image to its users.
Additional permissions should be obtained from the applicable author or publisher of the image.
Full text @ J. Lipid Res.