
|
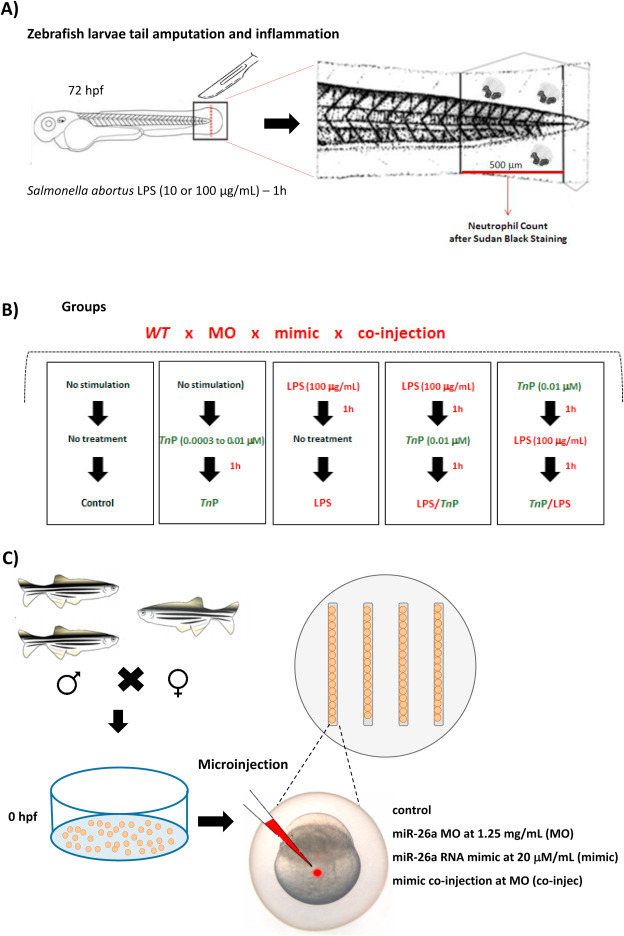
Fig. 1 Schematic diagram of inflammation induction, TnP treatment regimens, and microinjection. Zebrafish larvae at 72 hpf previously treated with PTU (20–50 per group) with amputated tail were exposed to stimulation and treatment for 1 h each at 28 °C as described: non-stimulated and non-treated (control), non-stimulated and treated with TnP alone at 0.0003, 0.003, and 0.01 μM (TnP-group), LPS-stimulated (S. abortus at 10 or 100 μg/mL) and non-treated (LPS-group), LPS-stimulated (S. abortus at 100 μg/mL) and treated with TnP at 0.01 μM (therapeutic, LPS/TnP), or treated with TnP at 0.01 μM and LPS-stimulated (S. abortus at 100 μg/mL) (prophylactic, TnP/LPS). After regimens, anesthetized and killed larvae were fixed and stained with Sudan black for absolute neutrophil number count in 500 μm from the cut of the tail (A and B). Embryos of 0 hpf (20–50 per group) mounted in the grooves present in the agarose-coated plate were microinjected with 2 or 3 nL in the yolk with MO (at 1.25 mg/mL), mimic (20 μM/mL), or co-injected with both (MO at 1.25 mg/mL + mimic at 20 μM/mL) using a microneedle coupled to the Injectman® 4 pneumatic microinjector (C).