
|
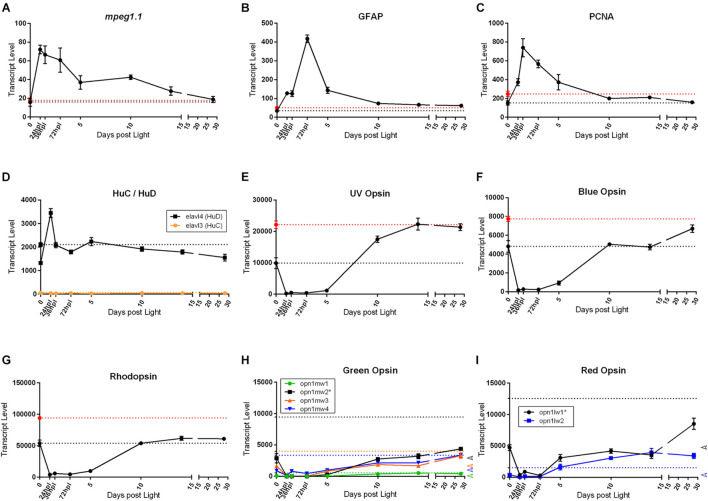
FIGURE 8
Common genes studied in retinal regeneration with dark adapted 0 h control, and naïve, non-dark adapted control baselines. All graphs in this figure represent transcript pseudo-counts for each of the genes listed above the plots from 3′mRNA-seq of individual adult zebrafish retinas for each timepoint (