
Fig. 6
- ID
- ZDB-IMAGE-211118-89
- Genes
- Publication
- Liu et al., 2021 - NudCL2 is an autophagy receptor that mediates selective autophagic degradation of CP110 at mother centrioles to promote ciliogenesis
- All Figures
- Figures for Liu et al., 2021
|
Fig. 6
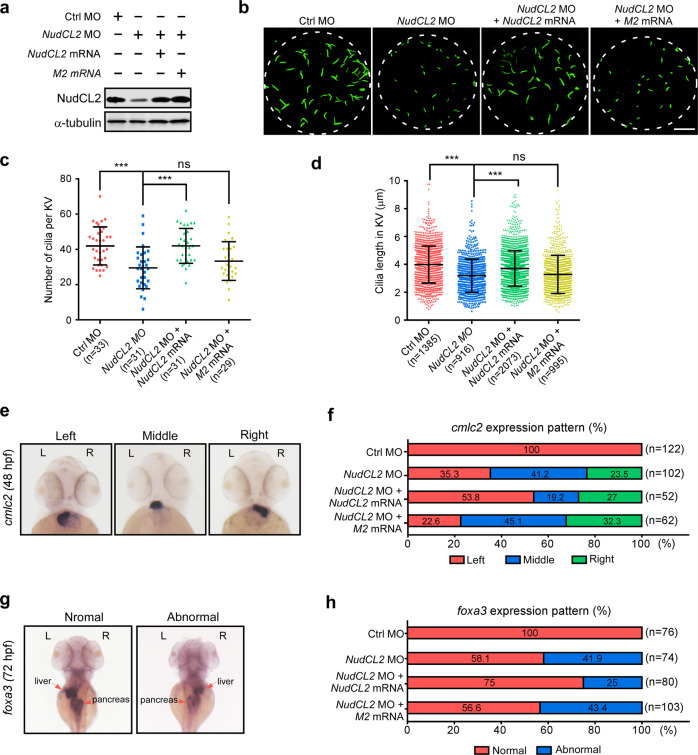
Embryos were injected with the indicated MOs and mRNAs, and collected at different times. a Western blot analysis of NudCL2 expression. α-tubulin was used as a loading control. b Immunofluorescence of cilia in KVs with anti-acetylated-α-tubulin antibody (green) at 6–8 somite stages. Scale bar, 10 µm. c, d Cilia number per KV was calculated and cilia length was measured using ImageJ software. e–h Whole-mount in situ hybridization with cmlc2 probe at 48 hpf or foxa3 probe at 72 hpf. Liver and pancreas are indicated by arrows and arrowheads, respectively. Quantification of the expression patterns of cmlc2 or foxa3 is shown (f, h). The data are presented as means ± SD derived from at least three independent experiments. n, sample size. ***P < 0.001; ns, not significant (P > 0.05); Student’s t-test.