
|
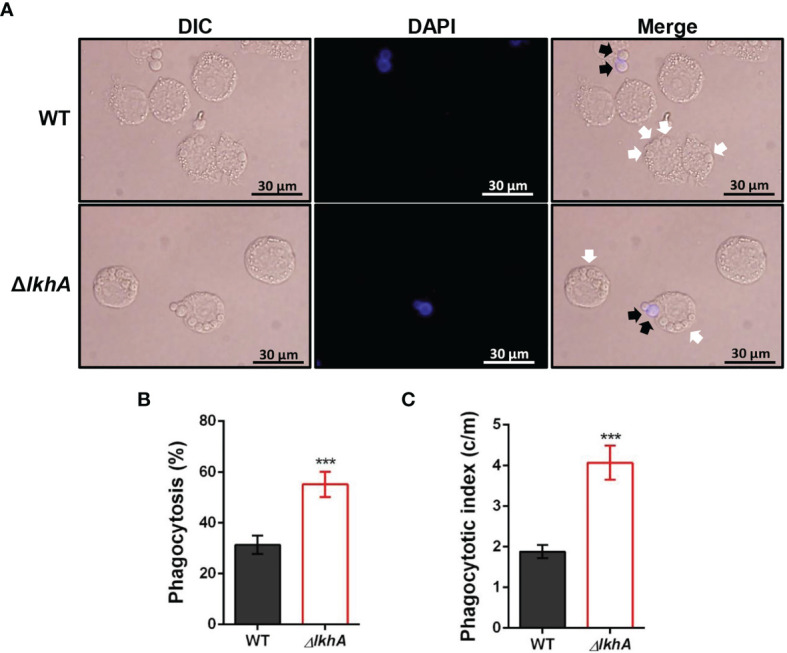
Figure 5
Alveolar macrophage response to ΔAflkhA conidia. MH-S murine alveolar macrophages were challenged with a three-fold concentration of WT and ΔAflkhA conidia and then incubated for 4 hrs at 37°C in an atmosphere of 5% CO2. (A) Microscopic analysis of the uptake of the fungal conidia by MH-S macrophages. External conidia (black arrows) were stained by calcofluor white (1 μg/mL in DPBS). White arrows indicate conidia endocytosed by macrophage cells. (B) Phagocytosis of conidia. The percentage of macrophages containing more than one ingested conidia was counted (n = 18). (C) Phagocytosis index. The average number of indigested conidia per macrophage (c/m) was calculated (n = 40). Statistical analysis was performed using the student’s t-test. ***P < 0.001.