IMAGE

Figure 2

ID
ZDB-IMAGE-211103-33
Source
Figures for Kler et al., 2021
Image
Figure Caption

Figure 2

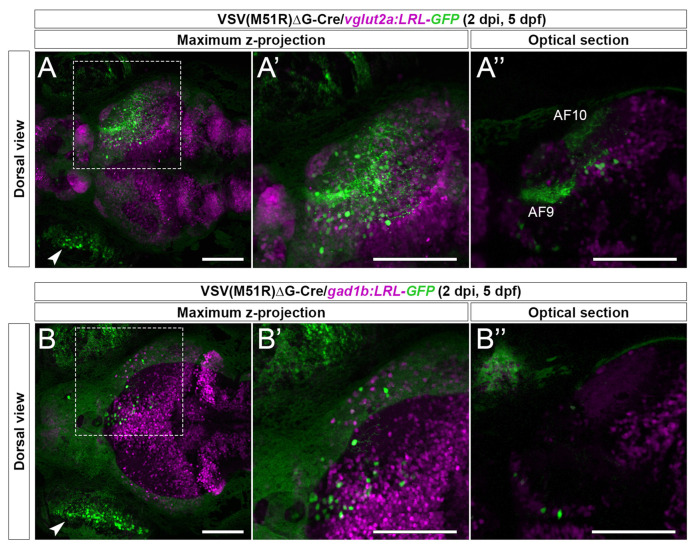
Cre-dependent TRAS-M51R labeling of specific retinorecipient neuron subtypes. (A–A”) Representative image of a 2 dpi (5 dpf) live vglut2a:LRL-GFP larvae injected with VSV(M51R)ΔG-Cre. Boxed area in (A) is shown in higher magnification in (A’; both show maximum z-projection). Panel (A”) shows a single optical section in the box area in (A), at the level of AF9. GFP expression was seen in the injected eye (arrowhead in A), retinorecipient cells (round green cells), and the AFs (AF9 and AF10 shown in A”). (B–B”) Representative image of a 2 dpi (5 dpf) live gad1b:LRL-GFP larvae injected with VSV(M51R)ΔG-Cre. Boxed area in (B) is shown in higher magnification in (B’) (both show maximum z-projection). Panel (B”) shows a single optical section in the box area in (B), at the level of AF9. GFP expression was seen in the injected eye (arrowhead in B) and retinorecipient cells. No AF labeling was seen. Green fluorescence in the uninjected eye was from the autofluorescence of retinal pigment epithelial cells. Scale bars are 100 μm.

Acknowledgments
This image is the copyrighted work of the attributed author or publisher, and ZFIN has permission only to display this image to its users. Additional permissions should be obtained from the applicable author or publisher of the image. Full text @ Front. Neuroanat.