IMAGE

Fig. 1

ID
ZDB-IMAGE-211009-55
Source
Figures for Fragale et al., 2021
Image
Figure Caption

Fig. 1

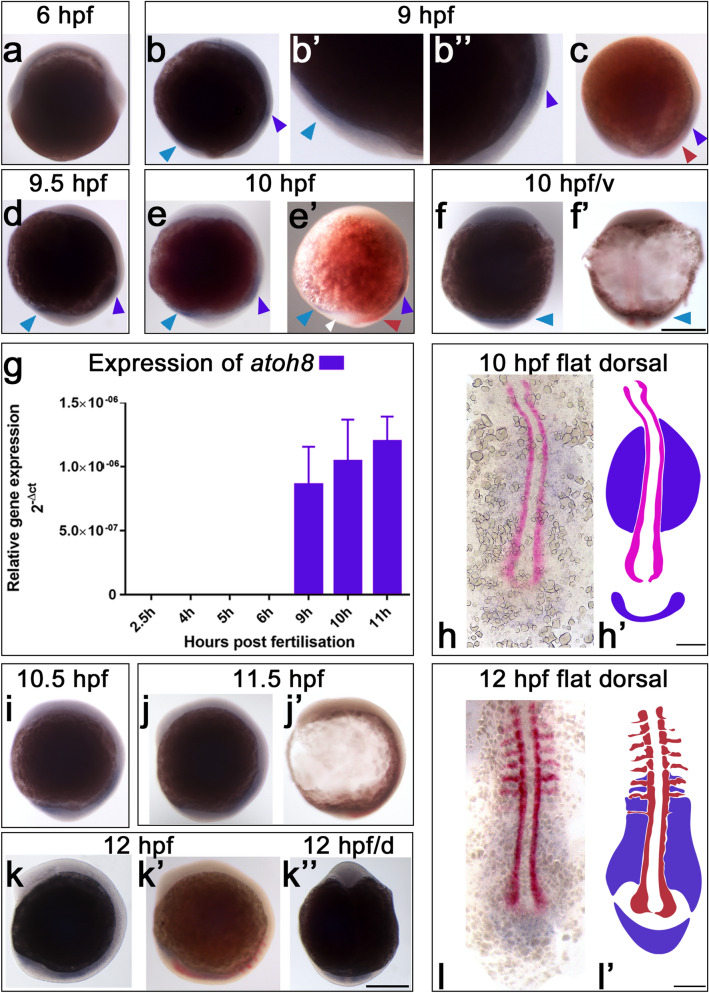
atoh8 (blue) and myoD expression (red) in the gastrula and early segmentation stages of development (6–12 hpf). a Shield stage (6 hpf). b 90% epiboly (9 hpf). b’, b’’ magnifications of image (b) showing dorsal and ventral atoh8 expression, respectively. c 9-hpf embryo double-stained for atoh8 and myoD. datoh8 expression at 9.5 hpf. e, e’ 10-hpf embryos stained for atoh8 alone and atoh8 and myoD, respectively; white arrowhead in e' indicates tail bud tissue free of atoh8 expression. f, f’ 10-hpf embryos stained for atoh8 alone and atoh8 and myoD, respectively. g results of RT-qPCR for atoh8 at developmental stages 2.5 to 11 hpf showing its expression relative to actb2. h, h’ Flat mount and schematic drawing of 10-hpf embryo showing atoh8 and myoD expression in blue and red, respectively. iatoh8 staining at 9.5 hpf. j, j’ 11.5-hpf embryos stained for atoh8 alone and atoh8 and myoD, respectively. k, k’’ 12-hpf embryos stained for atoh8. k’ 12-hpf embryo double-stained for atoh8 and myoD. l, l’ Flat mount and schematic drawing of 12-hpf embryo showing atoh8 and myoD expression in blue and red, respectively. Whole embryos: lateral view, anterior to the top, dorsal to the right. d’ ventral view (v); f, h, k, l dorsal view. Blue and red arrowheads: sites of atoh8 and myoD expression, respectively. Scale bars 200 µm

Acknowledgments
This image is the copyrighted work of the attributed author or publisher, and ZFIN has permission only to display this image to its users. Additional permissions should be obtained from the applicable author or publisher of the image. Full text @ Histochem. Cell Biol.