
Image
|
Figure Caption
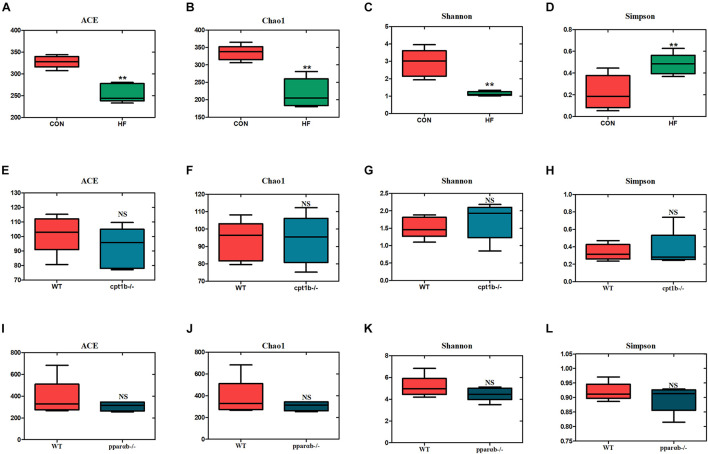
FIGURE 2 Boxplots of α diversity indices of bacterial community based on 16S rRNA sequencing. (A–D) Gut microbial α diversity of dietary groups based on (A) ACE, (B) Chao1, (C) Shannon, and (D) Simpson. (E–H) Gut microbial α diversity of WT and cpt1b–/– zebrafish groups based on (E) ACE, (F) Chao1, (G) Shannon, and (H) Simpson. (I–L) Gut microbial α diversity of WT and pparab–/– zebrafish based on (I) ACE, (J) Chao1, (K) Shannon, and (L) Simpson. All data are normalized to control group (100%) (**p < 0.01).
Acknowledgments
This image is the copyrighted work of the attributed author or publisher, and
ZFIN has permission only to display this image to its users.
Additional permissions should be obtained from the applicable author or publisher of the image.
Full text @ Front Microbiol