
Fig. 1
- ID
- ZDB-IMAGE-211006-1
- Publication
- Leach et al., 2021 - The immune response is a critical regulator of zebrafish retinal pigment epithelium regeneration
- All Figures
- Figures for Leach et al., 2021
|
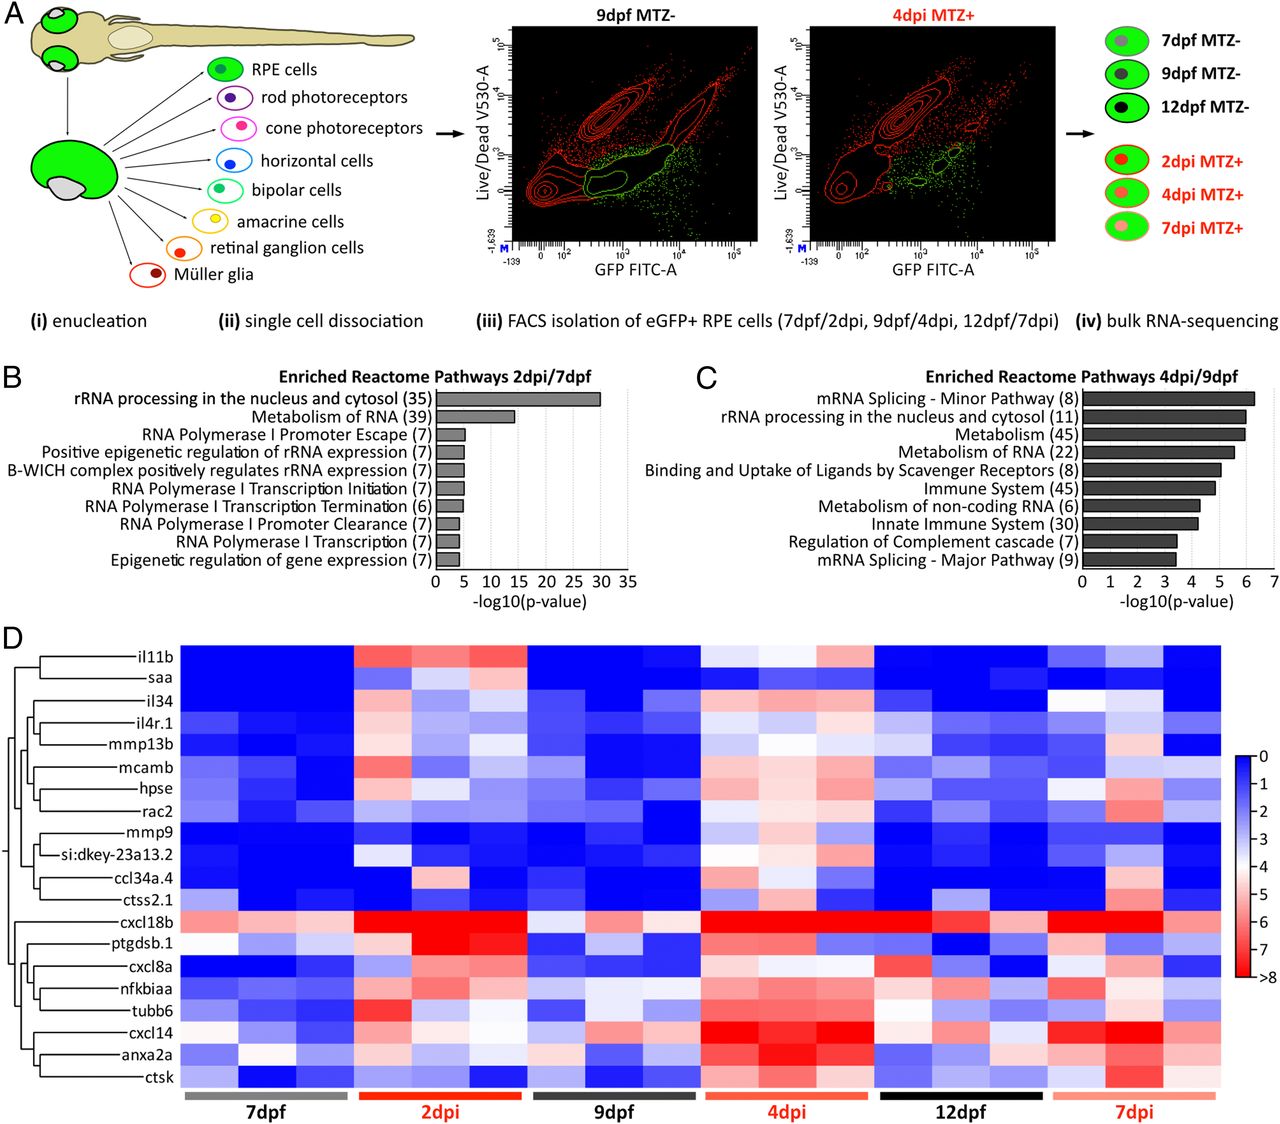
Fig. 1 Enrichment of immune system genes during RPE regeneration. (A) Experimental workflow showing steps for tissue processing (i, ii) and isolation of eGFP+ RPE (iii, iv). Example 9 dpf and 4 dpi FACS plots showing cell sorting gate (iii; green). (B and C) Top Reactome pathways enriched from groups of significant DEGs at 2 dpi/7 dpf (B) and 4 dpi/9 dpf (C). Numbers in parentheses indicate quantities of significantly enriched DEGs. (D) Heatmap showing hierarchical clustering of immune-related genes in the top 50 up-regulated DEG sets from 2 dpi/7 dpf and 4 dpi/9 dpf (SI Appendix, Tables S1 and S2). Heatmap legend represents log2 (transcripts per million +1).