
|
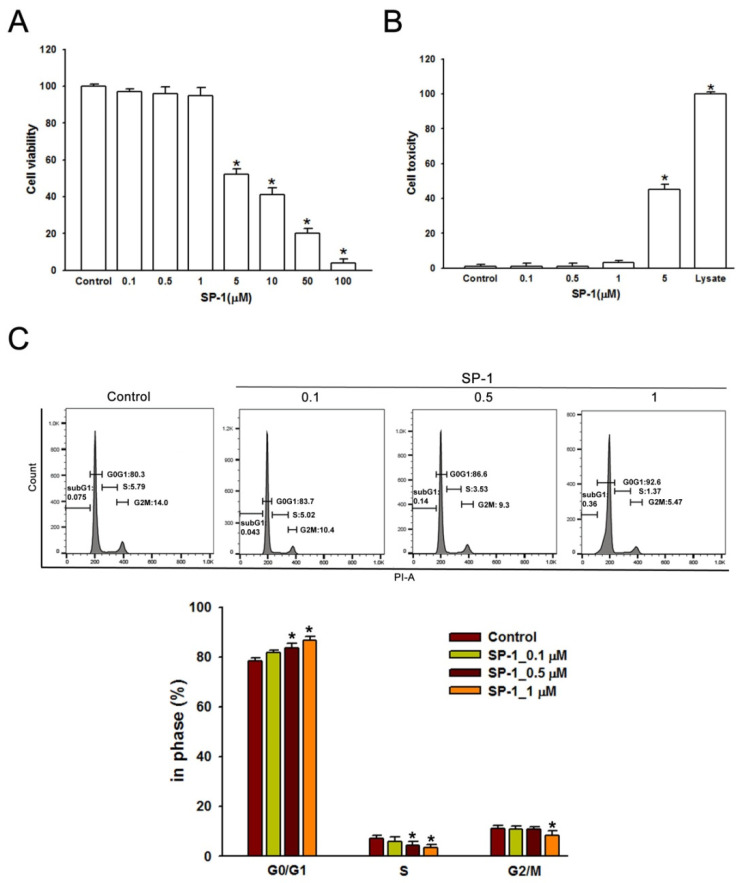
Figure 4
Heteronemin inhibited cell growth and arrested the distribution of cell cycle in human lymphatic endothelial cells. (A) LECs were incubated with various doses (0–100 μM) of heteronemin (indicated as SP-1) in a 96-well plate for 24 h. Cell viability was determined by MTT assay after treatment. The maximal non-toxic dose was chosen for further experiments. (B) Cells were treated with SP-1 for 8 h; then, the cytotoxicity was determined using LDH assay. (C) Cells were treated with various concentrations of SP-1 for 24 h and were then analyzed using flow cytometry. Histograms represent the percentage of cells in each cell cycle phase. The graph corresponds to the distribution of cell subpopulation percentages expressed as means ± SEM of five independent assays. * p < 0.05 compared with solvent control (0.01% DMSO).