
Fig. 2.
- ID
- ZDB-IMAGE-210930-22
- Publication
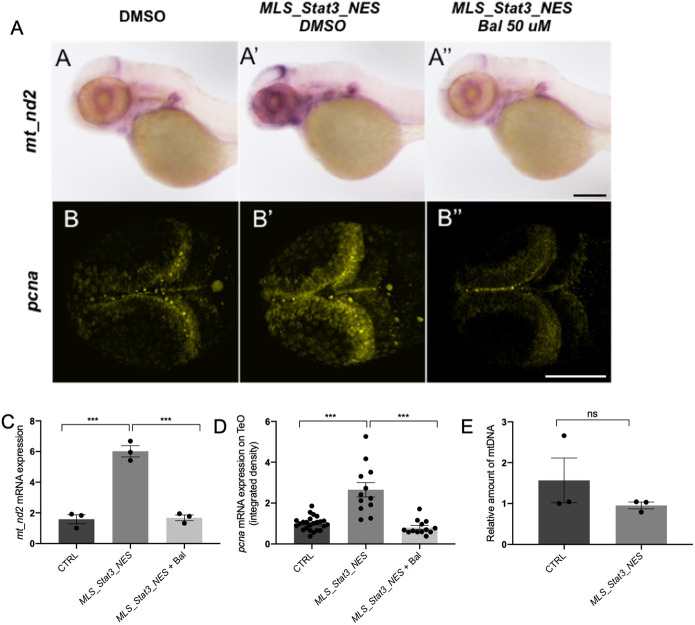
- Peron et al., 2021 - Y705 and S727 are required for mitochondrial import and transcriptional activities of STAT3 and regulate proliferation of embryonic and tissue stem cells
- All Figures
- Figures for Peron et al., 2021
|
Fig. 2.