
|
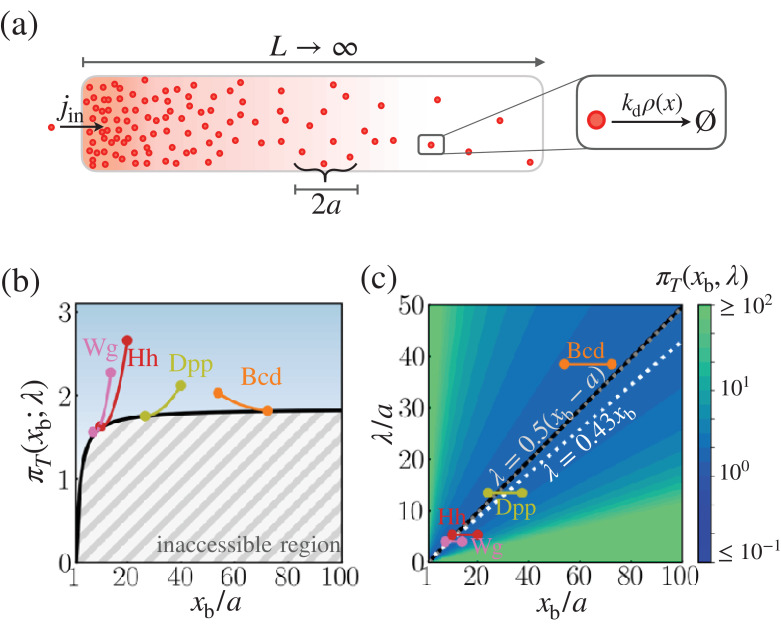
Figure 3.
(a) Schematic of the model. (b) The optimal trade-off product obtained numerically with respect to the location of the target boundary position normalized by the sensor size (). The gray hashed area represent the inaccessible regions. Shown are the trade-off products of the morphogens profiles of Bcd, Wg, Hh, and Dpp. (c) The black line denotes the optimal characteristic decay length () with respect to the position . The color scale indicates the trade-off product computed for each pair of and values. The gray dotted line depicts the linear approximation of . The white dotted line depicts the linear approximation of for the point measurement model. In (b) and (c), the depicted trade-off product is normalized by . The parameters for the naturally occurring morphogen profiles are further described in the Appendix 3, Length scales of Bcd, Wg, Hh, and Dpp, and Appendix 3—table 1.
Cost-precision trade-off associated with the space-time-averaged measurement.