
Figure 1
- ID
- ZDB-IMAGE-210902-63
- Genes
- Publication
- Naef et al., 2021 - Efficient Neuroprotective Rescue of Sacsin-Related Disease Phenotypes in Zebrafish
- All Figures
- Figures for Naef et al., 2021
|
Figure 1
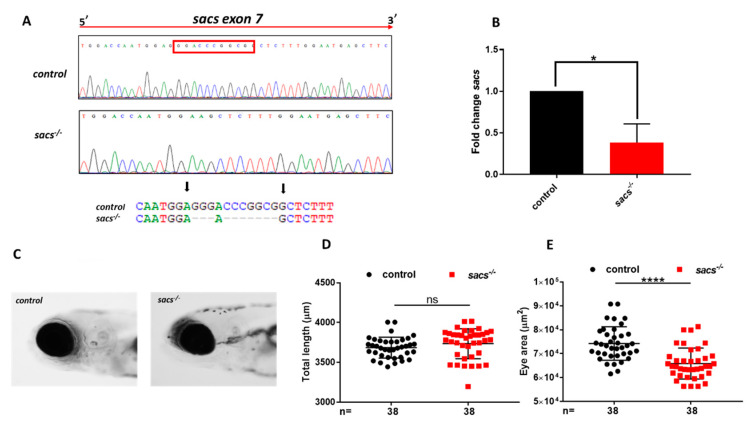
Generation of sacs-null mutant zebrafish. (A) Sequencing chromatographs of control and sacs-null mutant (sacs−/−)specimens and alleles. The red rectangle define frameshift mutation in exon 7. The arrow indicates the area of the induced deletion. (B) qRT-PCR analysis revealed a decrease in the level of sacs mRNA expression, normalized to β-actin. Three independent RNA samples from sacs−/− mutant larvae at 120 hpf and from controls were analyzed. * p ≤ 0.05, calculated by Student’s t-test. (C) Lateral view photographs of representative control and sacs−/− specimens. (D) No dysmorphology and full length was noted at 120 hpf, but (E) homozygous larvae showed slight but significant “microphthalmia”, **** p ≤ 0.00001, calculated by Mann-Whitney test. The values are expressed as mean ± standard deviation (SD). Abbreviations: n, total number of evaluated embryos; error bars indicate standard errors of the means; ns, not significant.