
Figure 2
- ID
- ZDB-IMAGE-210902-258
- Publication
- Sun et al., 2021 - Evolution and Functional Characteristics of the Novel elovl8 That Play Pivotal Roles in Fatty Acid Biosynthesis
- All Figures
- Figures for Sun et al., 2021
|
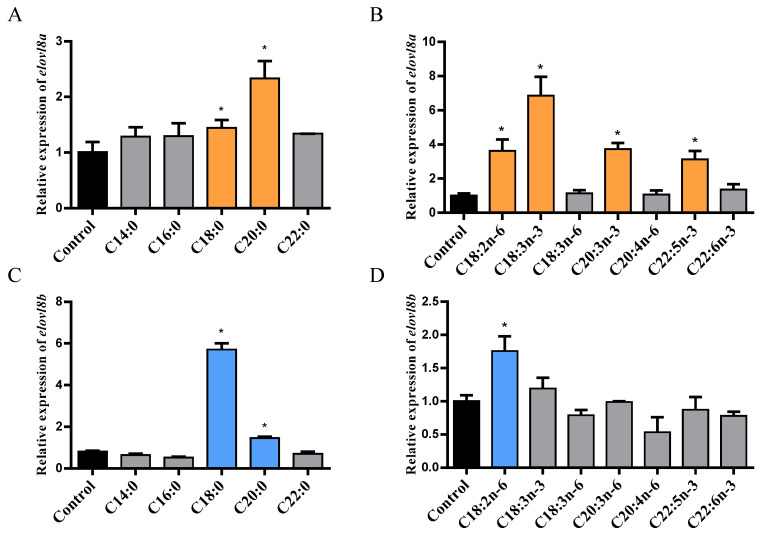
Figure 2
The mRNA expression levels of elovl8a and elovl8b in different fatty acids treatment zebrafish liver (ZFL) cell. (A,B) The expression levels of elovl8a in ZFL cells supplemented with SFAs (A) or PUFAs (B). (C,D) The expression levels of elovl8b in SFAs (C) or PUFAs (D) treatment ZFL cell. The statistical analyses were conducted by t test. Data were expressed as mean ± SD (standard deviation) of three biological replicates. The asterisks labeled above the error bars indicated significant differences (* p < 0.05). SFAs, saturated fatty acids; MUFAs, monounsaturated fatty acids; PUFAs, polyunsaturated fatty acids; elovl, elongation of very long-chain fatty acid protein.