
Figure 5
- ID
- ZDB-IMAGE-210902-145
- Genes
- Publication
- Sarkar et al., 2021 - Involvement of Oxidative and Endoplasmic Reticulum Stress in RDH12-Related Retinopathies
- All Figures
- Figures for Sarkar et al., 2021
|
Figure 5
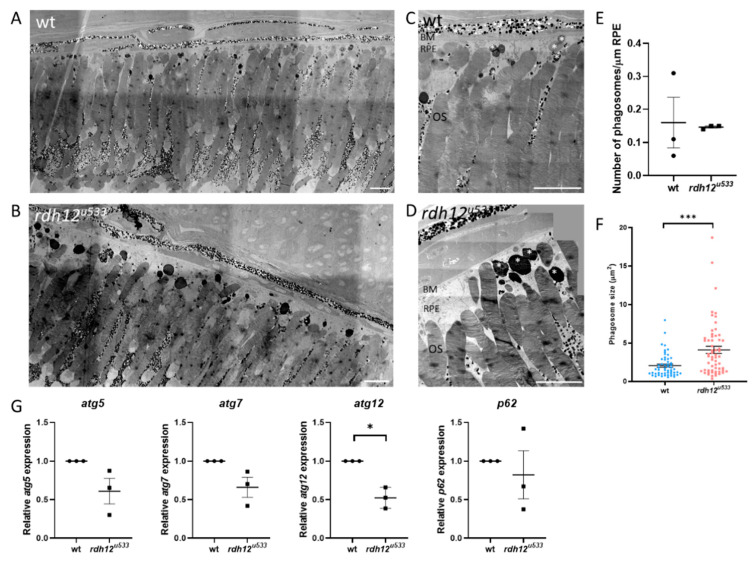
Retinal ultrastructure of wt and rdh12u533 mutant fish. Transmission electron microscopy was used to assess retinal ultrastructure of wt (A,C) and rdh12u533 (B,D) fish at 12 mpf. Phagosomes are indicated with white asterisks. Scale bar = 50 µm. (E) No significant difference was noted in the number of phagosomes between wt and rdh12u533 fish. (F) Phagosomes were significantly larger in the rdh12u533 fish at 12 mpf. Data are displayed as mean ± SEM. Phagosome number and size was quantified using ImageJ from three wt and rdh12u533 fish. Statistical significance was analysed by Mann–Whitney, *** p ≤ 0.001. (G) mRNA expression of autophagy genes in the retina of 12 mpf fish was analysed by RT-qPCR. Expression of atg12 was significantly reduced in the rdh12u533 fish. * p ≤ 0.05. OS, outer segment; RPE, retinal pigment epithelium; BM, Bruch’s membrane.